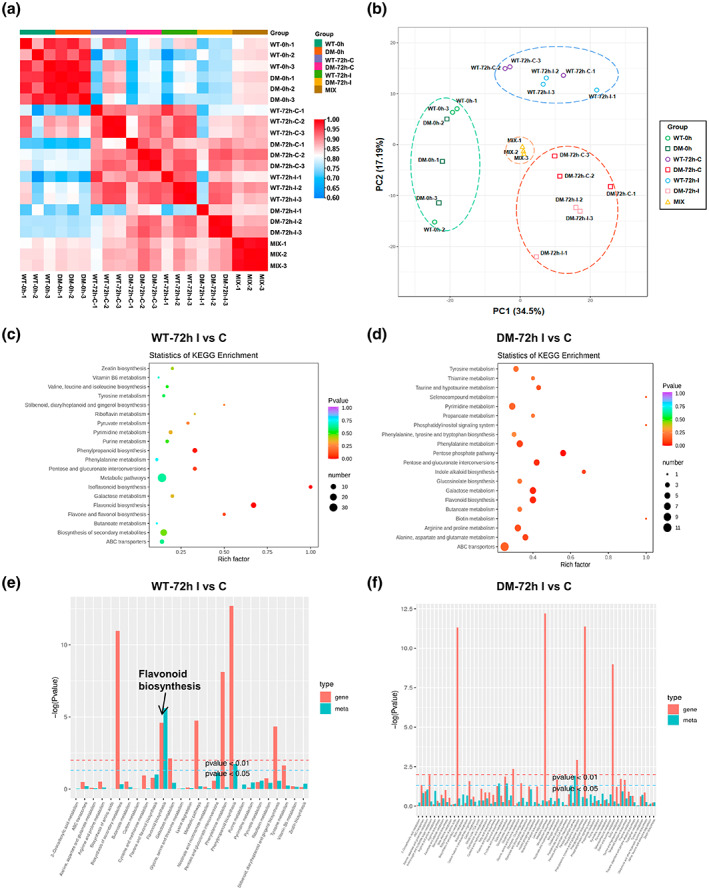
FIGURE 6.

Metabolome analysis in the wild type and Zmsiz1a/1b double mutant kernels after inoculation with Fusarium verticillioides. The correlation heat map and (b) the principal component analysis (PCA) score plot of metabolome data from the wild type (WT) and the Zmsiz1a/1b double mutant (DM) at 0 and 72 h after mock treatment (C) or inoculation (I). The MIX groups were mixed samples and analysed as a control. (c, d) KEGG enrichment analyses of metabolites altered by F. verticillioides infection in the WT and DM kernels. (e, f) DEG and DAM enrichment in KEGG pathways in the WT and DM, respectively
