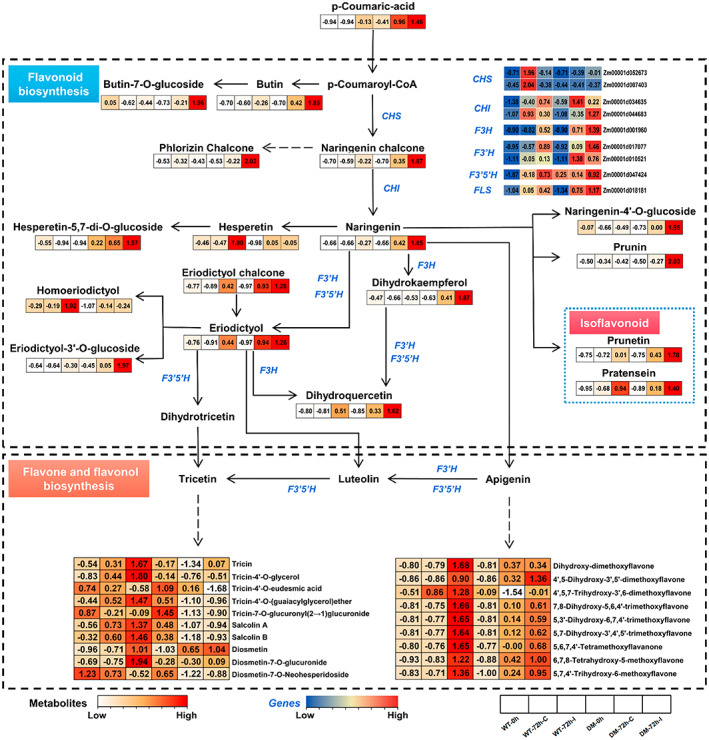
FIGURE 7.

Effects of Fusarium verticillioides inoculation on the biosynthesis network for flavonoid metabolites. The heatmap represents relative expression levels of indicated genes (from blue to red) and metabolites (white to red). The heatmap of gene expression was created by the FPKM values from RNA‐Seq. Values represent log2 fold‐change values among different sample groups. Solid arrows represent a direct step, while dotted arrows represent multiple steps. CHS, chalcone synthase; CHI, chalcone isomerase; F3H, flavonoid 3‐hydroxylase; F3′H, flavonoid 3′‐hydroxylase; F3′5′H, flavonoid‐3′,5′‐hydroxylase; FLS, flavonol synthase
