
Extended Data Figure 1: PI3Kδ inhibition minimally decreases ALL peripheral disease burden.
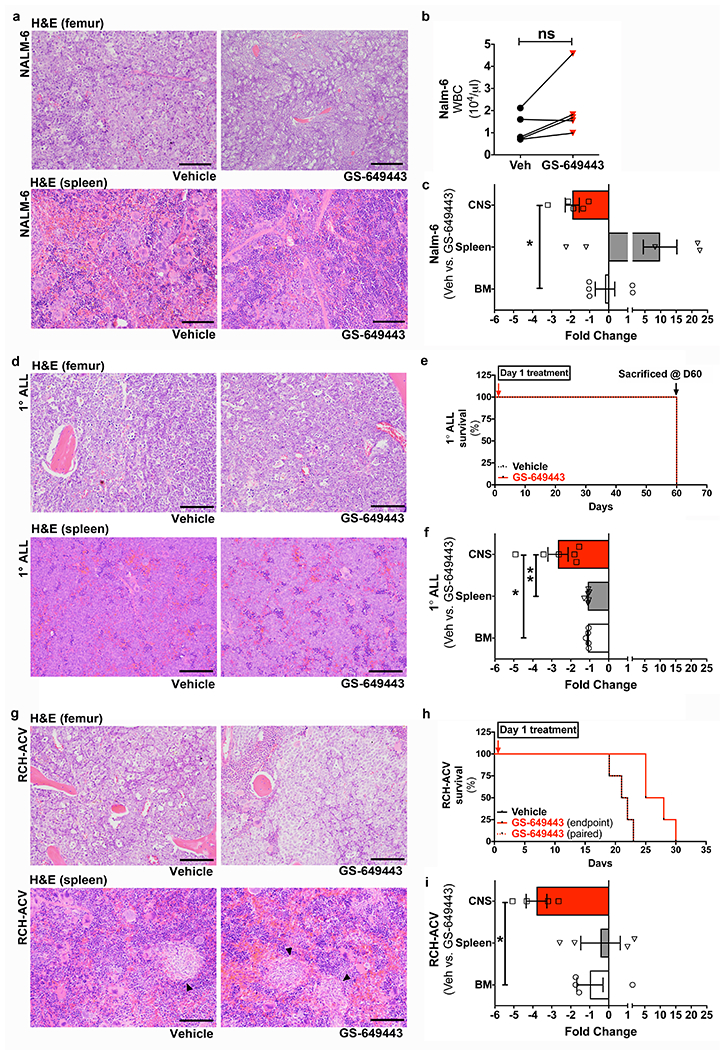
a, Representative H&E stained histologic sections showing Nalm-6 disease burden in the femoral BM and spleen of mice treated with vehicle or GS-649443, at matched time points (n = 6 mice per treatment group). b, Complete blood counts of vehicle and GS-649443-treated mice, at matched timepoints (paired two-tailed Student’s t-test, n = 5 mice per treatment group, P = 0.2158). c, Fold changes in CNS vs. systemic disease burden in vehicle and GS-649443-treated Nalm-6 mice (mean ± s.e.m., ANOVA with Tukey’s multiple comparison test, n = 5 mice per treatment group, P = 0.0314). d, Representative histologic sections showing 1°ALL disease burden in the femoral BM and spleen of mice treated with vehicle or GS-649443, at matched time points (n = 5 mice per treatment group). e, 1°ALL mice experimental plan. f, Fold changes in CNS vs. systemic disease burden in vehicle and GS-649443-treated 1°ALL mice (mean ± s.e.m., ANOVA with Tukey, n = 5 mice per treatment group, P = 0.00128 (CNS vs. BM), P = 0.0098 (CNS vs. spleen)). g, Representative histologic sections showing RCH-ACV disease burden in the femoral BM and spleen of mice treated with vehicle or GS-649443 (n = 4 mice per treatment group). Arrowheads indicate RCH-ACV blasts. h, Kaplan-Meier survival curve for RCH-ACV mice (two-sided log rank Mantel-Cox, n = 5 mice per treatment group, P = 0.0067). i, Fold changes in CNS vs. systemic disease burden in vehicle and GS-649443-treated RCH-ACV mice (mean ± s.e.m., ANOVA with Tukey, n = 4 mice per treatment group, P = 0.0244). Scale bars, 100 μm.