
Extended Data Figure 3: PI3Kδ inhibition reduces myosin light chain activity but does not affect intra-bone marrow migration of Nalm-6 cells.
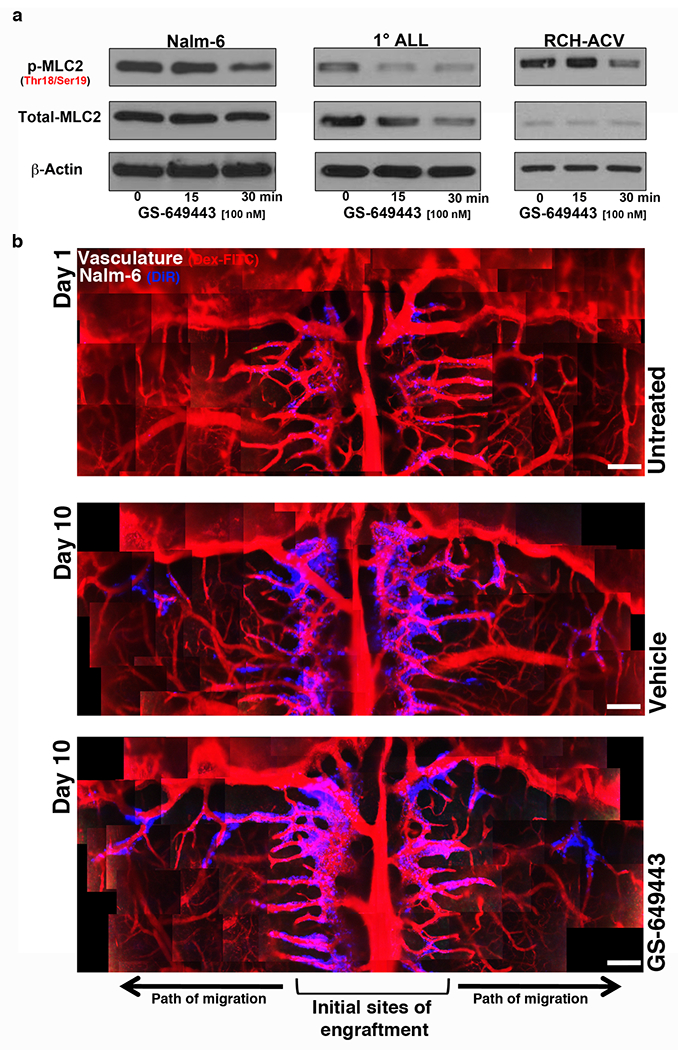
a, WB of MLC2 levels in ALL following GS-649443 treatment. For gel source data, see Supplementary Figure 1 (Nalm-6: n = 3 independent experiments, 1° ALL: n = 2 independent experiments, RCH-ACV: n = 3 independent experiments). b, Representative intravital microscopy images of ALL cell intra-BM migration over time in vehicle vs. GS-649443-treated mice (n = 3 mice per treatment group). Scale bars, 250 μm.