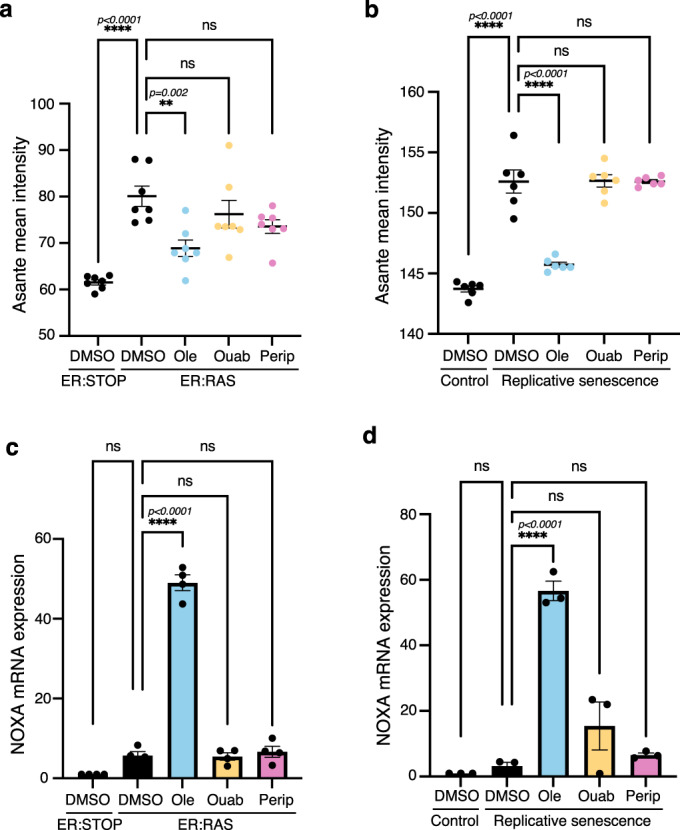
Fig. 5. Activity of oleandrin and periplocin on their senolytic targets.

a, b Intracellular K+ levels measured using Asante staining in a 100 nM 4OHT containing cultures of senescent IMR90 ER:RAS cells treated with 10 nM oleandrin, ouabain and periplocin, or DMSO as vehicle control, compared with IMR90 ER:STOP controls (n = 7), and b in IMR90 cells at passage 27 (replicative senescence) treated with 10 nM oleandrin, ouabain and periplocin, or DMSO as control vehicle compared to IMR90 cells at passage 13 (control) (n = 6). Data represented as individual data points and the mean ± SEM. Statistical analysis was performed using a one-way ANOVA (Tukey’s test) for multiple comparisons. Representative images of Asante cell staining are shown in Supplementary Fig. 9h, i. c, d mRNA expression of NOXA determined by RT-qPCR in c 100 nM 4OHT containing cultures of senescent IMR90 ER:RAS cells treated with 10 nM oleandrin, ouabain and periplocin, and DMSO as control, compared to control IMR90 ER:STOP cells (n = 4), and d IMR90 cells at passage 27 (replicative senescence) treated with 10 nM oleandrin, ouabain and periplocin, and DMSO control compared to IMR90 proliferating cells at passage 13 (control) (n = 3). Data represented as individual data points and the mean ± SEM. Statistical analysis was performed using a one-way ANOVA (Dunnett’s test) for multiple comparisons. ns not significant, *p < 0.05, **p < 0.01, ***p < 0.001, ****p < 0.0001. Source data are provided as a Source Data file.
