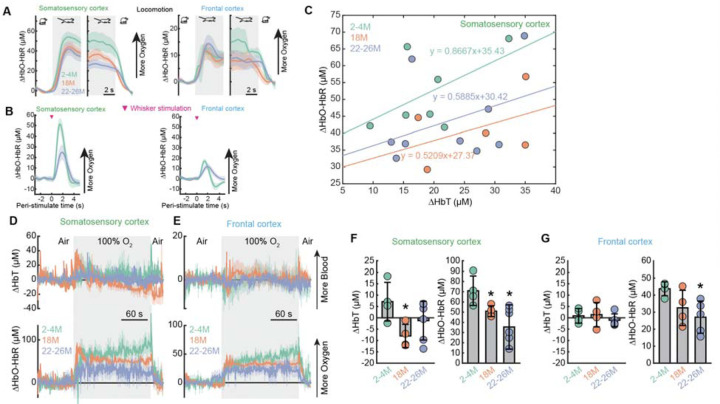
Figure 7. Oxygen carrying capacity of the blood is reduced by aging.
(A) Population average of locomotion onset and offset triggered average of brain oxygenation (∆HbO-HbR) responses in FL/HL and FC across different age groups. (B) Average population responses of ∆HbO-HbR to contralateral whisker stimulation in the FL/HL and FC acros different age groups. (C) Relationship between locomotion evoked change in ∆HbT and ∆HbO-HbR, 2–5 s after the onset of locomotion, across different age groups, in FL/HL. (D) Population average of ∆HbT (top) and ∆HbO-HbR (bottom) responses to inhalation of 100% oxygen in the FL/HL across different age groups. (E) As in (E) but for FC. (F) Group average of fractional changes of ∆HbT (left) and ∆HbO-HbR (right) in response to 100% oxygen in FL/HL acros different age groups. (G) As in (F) but for FC. Solid lines and shaded areas in (A, B, E, F) denote mean ± SEM, respectively. Data are shown as mean ± SD in all other graphs.

