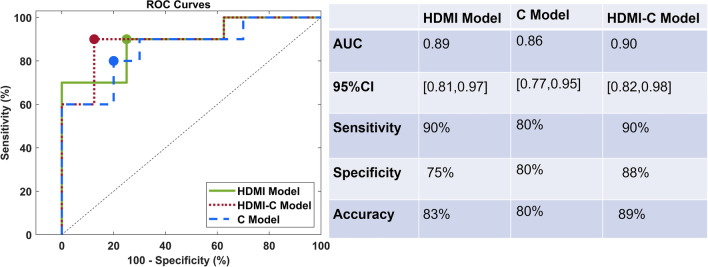
Fig. 5.
ROC curves generated with HDMI biomarkers extracted from HDMI images, and clinical biomarkers. Green line represents the HDMI model, red line depicts HDMI-C model, and the blue line corresponds to the C model. The table on the right side of the figure contains a summary of the test-set performance of the biomarkers in discriminating metastatic and reactive ALNs. HDMI = high-definition microvasculature imaging, HDMI-C = high-definition microvasculature imaging + clinical data, AUC = area under the curve, ROC = receiver operating characteristic.

