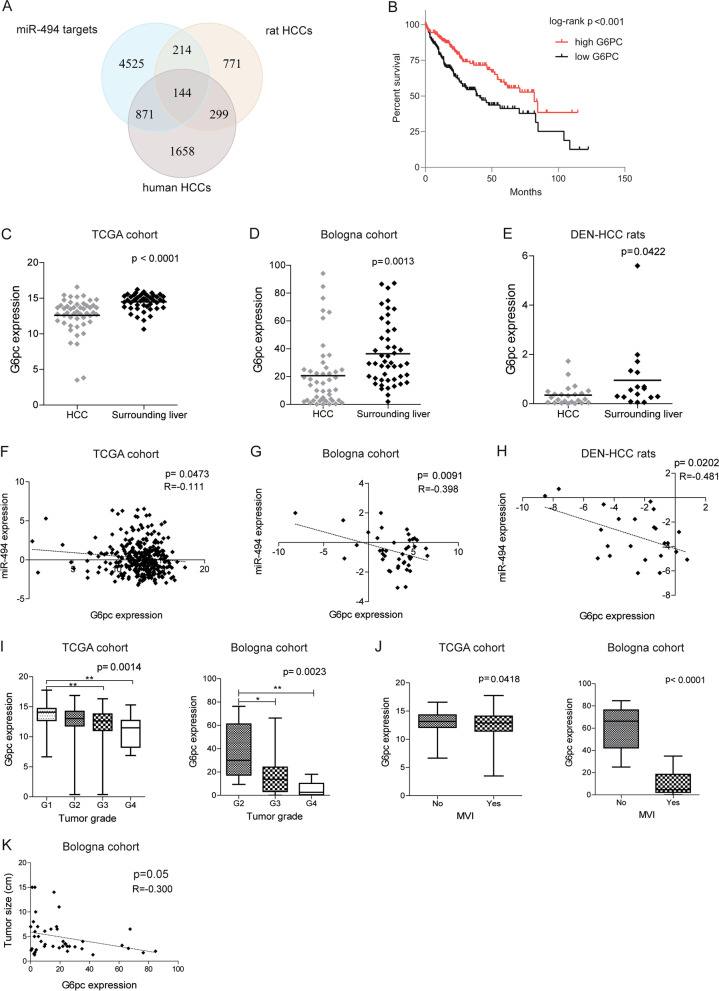
Fig. 1.
Deregulated expression of G6pc in human and rat HCCs and association with clinicopathological features. A Venn diagram of miR-494 putative targets (Targetscan algorithm) and downregulated genes in human (TCGA-HCC) and rat (DEN-HCC model) HCCs with respect to surrounding livers. B Kaplan–Meier curves of high and low G6pc-expressing HCCs (TCGA cohort). C-E Box plot graphs of G6pc mRNA levels in HCC and surrounding livers from the TCGA (N = 49) and Bologna (N = 46) cohorts and DEN-HCC rats (N = 18). Y-axes report G6pc mRNA expression. Real Time PCR was run in triplicate. F–H Correlation graphs between miR-494 and G6pc mRNA levels in HCC tissues of the TCGA (N = 319) and Bologna (N = 42) cohorts and tumor nodules (N = 23) of DEN-HCC rats. Axes report 2−ΔΔCt values corresponding to miR-494 and G6pc levels transformed in a log2 form. Real Time PCR was run in triplicate. I Box plot graphs of G6pc mRNA levels in HCCs from the TCGA (N = 365) and Bologna (N = 42) cohorts according to tumor grade. On the top of each graph is reported the p-value relative to ANOVA, whereas stars represent comparison between groups (Tukey’s post hoc test). Y-axes report G6pc mRNA expression. Real Time PCR was run in triplicate. J Box plot graphs of G6pc mRNA levels in HCCs of the TCGA (N = 298) and Bologna (N = 25) cohorts divided according to the presence or absence of microvascular invasion (MVI). Y-axes report G6pc mRNA expression. Real Time PCR was run in triplicate. K Correlation graph between G6pc mRNA levels and tumor size of HCC patients (N = 42) from the Bologna cohort. Axes report 2−ΔΔ.Ct values corresponding to G6pc mRNA levels and tumor size (cm). GAPDH was used has housekeeping gene. Real Time PCR was run in triplicate. ANOVA, two-tailed unpaired Student's t-test and Pearson’s correlation were used. * P ≤ 0.05; ** P ≤ 0.01

