Fig. 3.
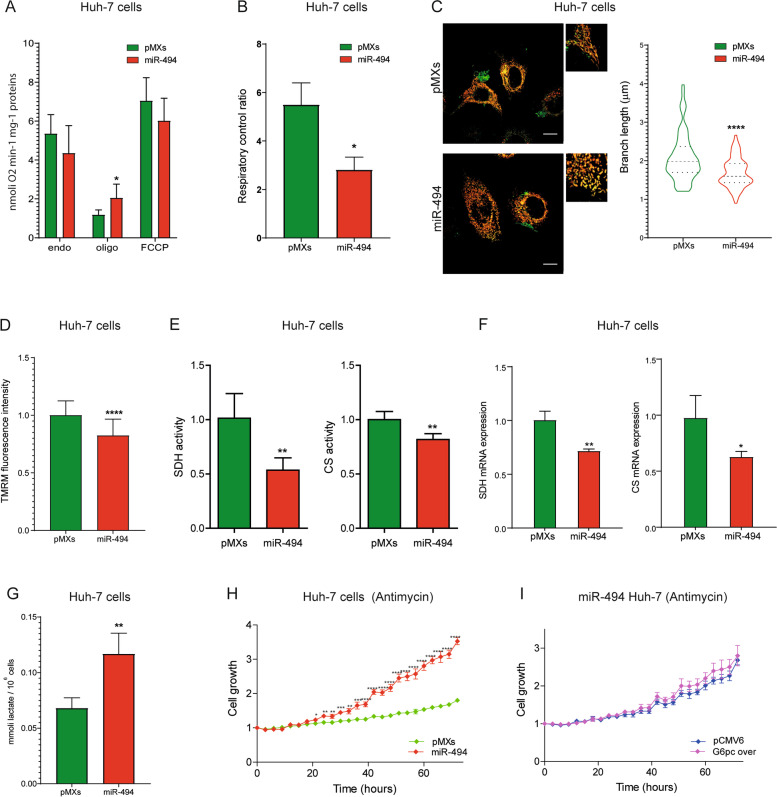
MiR-494 regulates cellular metabolism in HCC cells. A Oxygen consumption rate in control (pMXs) and miR-494-overexpressing Huh-7 cells measured in standard medium (endogenous respiration); in the presence of oligomycin A (Oligo) and carbonyl cyanide 4-(trifluoromethoxy) phenylhydrazone (FCCP). Mean ± SD values are displayed. Three independent experiments were performed. B Respiratory control ratio of control (pMXS) and miR-494-overexpressing Huh-7 cells. Three independent experiments were performed. C Representative confocal images of control (pMXs) and miR-494-overexpressing Huh-7 cells after staining with TMRM (red) and Mitotracker Green (MTG, green). Inset panels show magnification of selected areas and the violin plot refers to the quantification of the mean length of mitochondrial branches (µM). Data were obtained by measuring at least thirty randomly selected cells in two independent experiments. D Quantification of ΔΨm in control (pMXs) and miR-494-overexpressing Huh-7 cells. Data were obtained by measuring five randomly selected fields in three independent experiments and are expressed as TMRM signal intensity normalized to control. Mean ± SD values are displayed. E Enzymatic activity of succinate dehydrogenase (SDH) and citrate synthase (CS) in control (pMXs) and miR-494-overexpressing Huh-7 cells. The Y-axis reports the enzymatic activity (µmol*min−1*mg−1) normalized to control. Mean ± SD values are displayed. Three independent experiments were analyzed in duplicate. F Real Time PCR analysis of succinate dehydrogenase (SDH) and citrate synthase (CS) expression in control (pMXs) and miR-494 overexpressing Huh-7 cells. Y-axis reports 2−ΔΔCt values corresponding to mRNA levels normalized to control. Mean ± SD values are displayed. Beta-actin was used as housekeeping gene. Real Time PCR analysis was performed in two independent experiments in triplicate. G Extracellular lactate quantification by HPLC in control (pMXs) and miR-494 overexpressing Huh-7 cells. Mean ± SD values are displayed. Three independent experiments were analyzed in duplicate. H Growth curves of control (pMXs) and miR-494 overexpressing Huh-7 cells in the presence of Antimycin A. Growth curves were normalized to T0. Mean ± SD values are reported. I Growth curves of miR-494 overexpressing Huh-7 cells transfected with G6pc overexpressing or empty (pCMV6) vector in the presence of Antimycin A. Growth curves were normalized to T0. Mean ± SD values are reported. H, I Live imaging curves were performed in two independent experiments in quadruplicate. Statistical significance was determined by two-tailed unpaired Student's t-test. * P ≤ 0.05; ** P ≤ 0.01; ***P ≤ 0.001; ****P ≤ 0.0001. PMXs: empty vector

