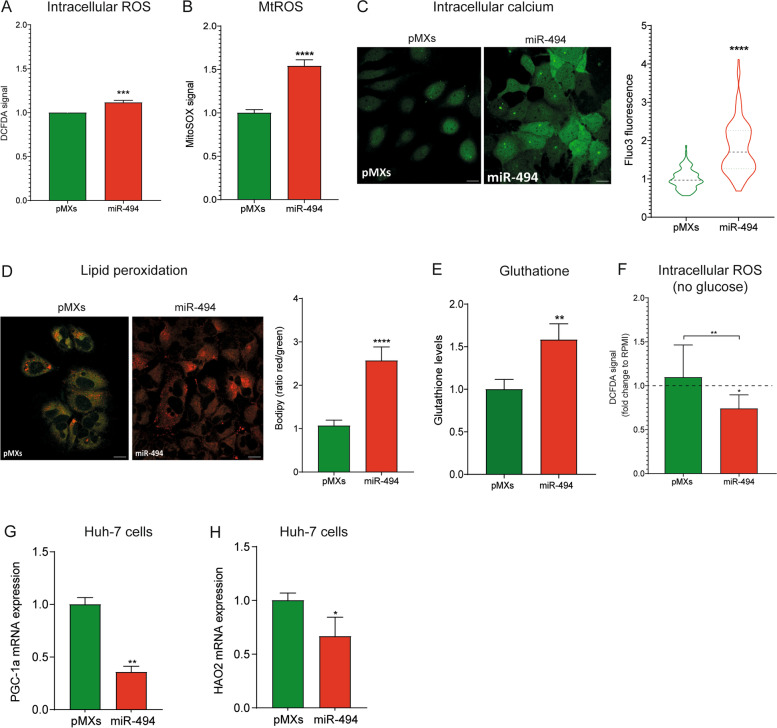
Fig. 5.
MiR-494 affects redox homeostasis in HCC cells. A ROS production in control (pMXs) and miR-494-overexpressing Huh-7 cells measured using dichlorofluorescin diacetate (DCFDA) and (B) mitochondrial superoxide production measured using the mitochondrial specific probe MitoSOX Red. Y-axes reports the arbitrary fluorescence units normalized to controls. Mean ± SD values are displayed. Three independent experiments were performed. C Representative confocal microscope images of control (pMXs) and miR-494-overexpressing Huh-7 cells stained with Fluo-3 AM. Violin plot reports the quantification of Fluo-3 intensity emission per cell normalized to control. Five randomly selected fields were analysed in two independent experiments. Mean ± SD values are displayed. Scale bar = 30 µm. D Lipid membrane peroxidation status in control (pMXs) and miR-494-overexpressing Huh-7 cells measured using the lipid peroxidation sensor BODIPY™ 581/591 C11. The oxidation of the dye results in a green-shift fluorescence emission peak. Y-axis reports quantification of the Red/Green intensity ratio per cell normalized to control. Five randomly selected fields were analysed in three independent experiments. Mean ± SD values are displayed. Scale bar, 30 µM. E Glutathione content in control (pMXs) and miR-494-overexpressing Huh-7 cells. Y-axis reports the luminescence signal relative to glutathione levels normalized to control. Mean ± SD values are displayed. Three independent experiments were performed. F ROS production in control (pMXs) and miR-494-overexpressing cells after 24 h of exposure to no-glucose medium measured using DCFDA. Data are presented as fold change of ROS production in no-glucose with respect to normal culture condition (RPMI). Three independent experiments were performed. G Real time PCR analysis of PGC-1alpha and (H) HAO2 mRNA levels in control (pMXs) and miR-494-overexpressing Huh-7 cells. Y-axis reports 2−ΔΔ.Ct values corresponding to mRNA levels. Normalized mean ± SD values are displayed. Beta-actin was used as housekeeping gene. Real Time PCR analysis was performed in two independent experiments in triplicate. The statistical analysis was performed using two-tailed unpaired Student's t-test. * P ≤ 0.05; ** P ≤ 0.01; *** P ≤ 0.001; **** P ≤ 0.0001

