Fig. 6.
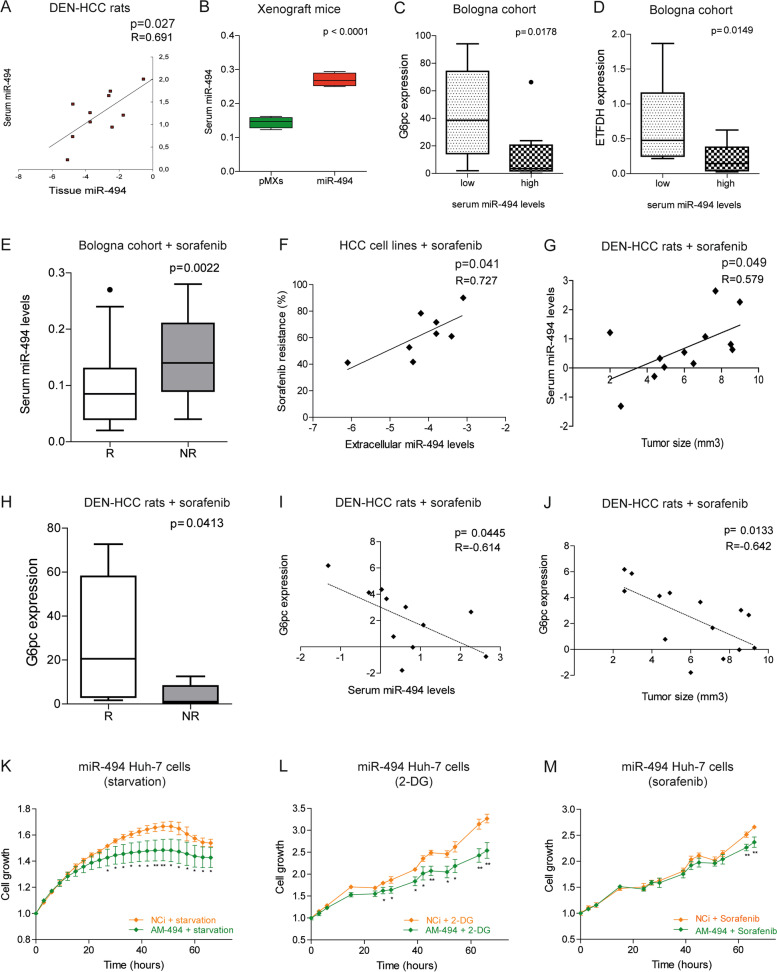
MiR-494 is a circulating biomarker and a therapeutic target in HCC. A Correlation graphs between tissue and serum miR-494 levels in DEN-HCC rats (N = 10). Axes report 2−ΔΔCt values corresponding to tissue and serum miR-494 levels transformed in a log2 form. U6RNA and cel-miR-39 were used as control genes for tissue and circulating miRNAs, respectively. Real Time PCR analysis was run in triplicate. B Box plot graph of serum miR-494 levels in xenograft mice (N = 8) control (pMXs) and miR-494-overexpressing Huh-7 cells. Y-axis reports 2−ΔΔCt values corresponding to serum miR-494 levels. Cel-miR-39 was used as control gene. Real Time PCR analysis was run in triplicate. C Box plot graphs of G6pc and (D) ETFDH tissue levels in HCC patients from the Bologna cohort expressing high (N = 10) and low (N = 12) miR-494 serum levels. Y-axes report 2−ΔΔCt values corresponding to mRNA levels. GAPDH was used as housekeeping gene. Real Time PCR analysis was run in triplicate. E Box plot graph of baseline miR-494 serum levels in responder (R; N = 43) and non-responder (NR; N = 23) sorafenib-treated patients from the Bologna cohort. Y-axis reports 2−ΔΔCt values corresponding to circulating miR-494 levels. Cel-miR-39 was used as control gene. Real Time PCR analysis was run in triplicate. F Correlation graph between extracellular miR-494 levels and sorafenib resistance in HCC cell lines (N = 8). Axes report 2−ΔΔCt values corresponding to extracellular miR-494 levels transformed in a log2 form and sorafenib resistance expressed as the ratio (percent value) of cell viability between treated and untreated cells. Real Time PCR analysis was run in triplicate. G Correlation graph between miR-494 serum levels and tumor size in sorafenib-treated DEN-HCC rats (N = 12). Axes report 2−ΔΔCt values corresponding to circulating miR-494 levels and tumor size (volume) of HCC nodules (mm3). Tumor volume was calculated with the formula V = (D1*D2*D3)/2. All the values were transformed in a log2 form. Cel-miR-39 was used as control gene. Real Time PCR analysis was run in triplicate. H Box plot graph of G6pc tissue levels in responder (R; N = 7) and non-responder (NR; N = 7) HCC nodules from sorafenib-treated rats. Y-axis reports 2−ΔΔCt values corresponding to G6pc mRNA levels. Beta-actin was used as housekeeping gene. Real Time PCR analysis was run in triplicate. I Correlation graph between G6pc tissue levels and miR-494 serum levels in sorafenib-treated DEN-HCC rats (N = 11). Axes report 2−ΔΔCt values corresponding to G6pC mRNA levels and circulating miR-494 levels transformed in a log2 form. Beta-actin and cel-miR-39 were used as control genes for tissue mRNAs and circulating miRNAs, respectively. Real Time PCR analysis was run in triplicate. J Correlation graph between G6pc tissue levels and tumor size of HCC nodules (N = 14) from sorafenib-treated DEN-HCC rats. Axes report 2−ΔΔCt values corresponding to G6pC mRNA levels and tumor size (volume, mm3) of HCC nodules transformed in a log2 form. Beta-actin was used as housekeeping gene. Real Time PCR analysis was run in triplicate. K Growth curves of miR-494-overexpressing Huh-7 cells transfected with antimiR-494 (AM-494) and negative control (NCi) and cultured in serum-deprived medium or (L) in the presence of 2-DG or (M) sorafenib. Growth curves were normalized to T0. Mean ± SD values are reported. The curves were performed in two independent experiments in quadruplicate. The statistical analysis was performed using two-tailed unpaired Student's t-test and Pearson’s correlation. * P ≤ 0.05; ** P ≤ 0.01; *** P ≤ 0.001; **** P ≤ 0.0001

