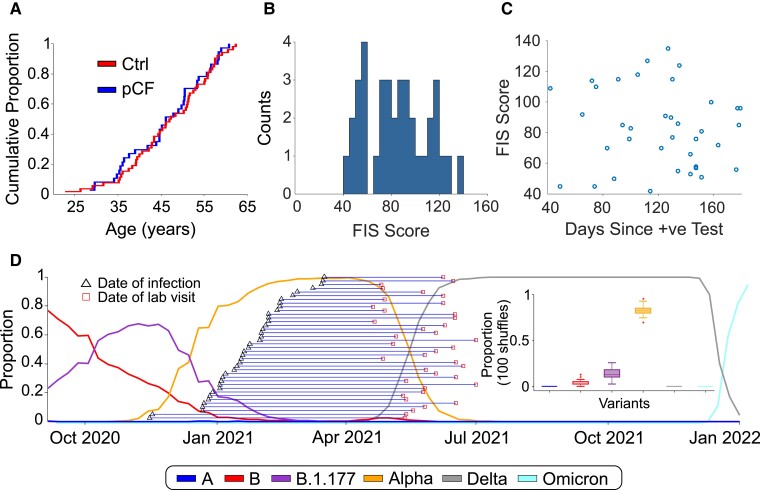
Figure 2.
Cohort demographics. (A) Cumulative age distribution plots for pCF and control subjects. (B) Distribution histogram of FIS scores reported by pCF subjects. (C) Lack of correlation of FIS score with time since SARS-CoV-2 infection (Pearson r2 = 0.009, P = 0.59, t-test). (D) Proportions of the most common SARS-CoV-2 variants in circulation in England since October 2020 and the estimated expected proportion of each variant across our cohort (based on 100 shuffles).

