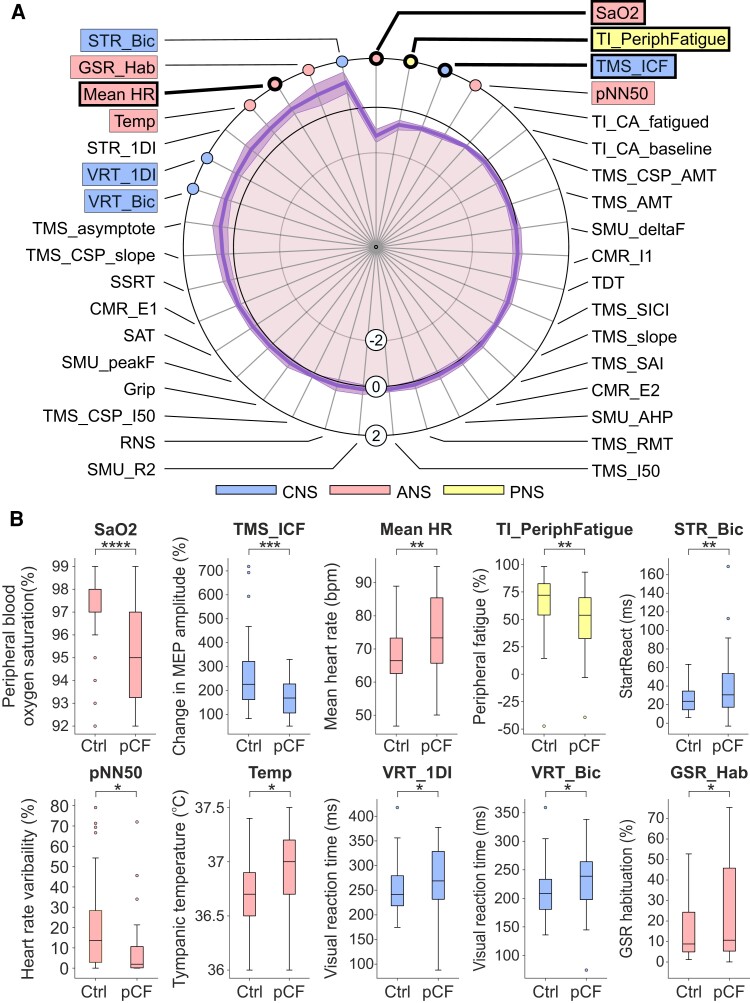
Figure 3.
Differences between pCF and control cohorts. (A) Results from the tests outlined in Fig. 1, normalized as Z-scores (difference between pCF and control subjects, scaled by SD). Measures highlighted within boxes were individually significantly different between pCF and controls (P < 0.05); for those with thicker lines, significance passed the Benjamini–Hochberg correction for multiple comparisons. (B) Distribution of the 10 measures which had uncorrected P < 0.05 as box-and-whisker plots across the two cohorts. *P < 0.05, **P < 0.01, ***P < 0.001, ****P < 0.0001.

