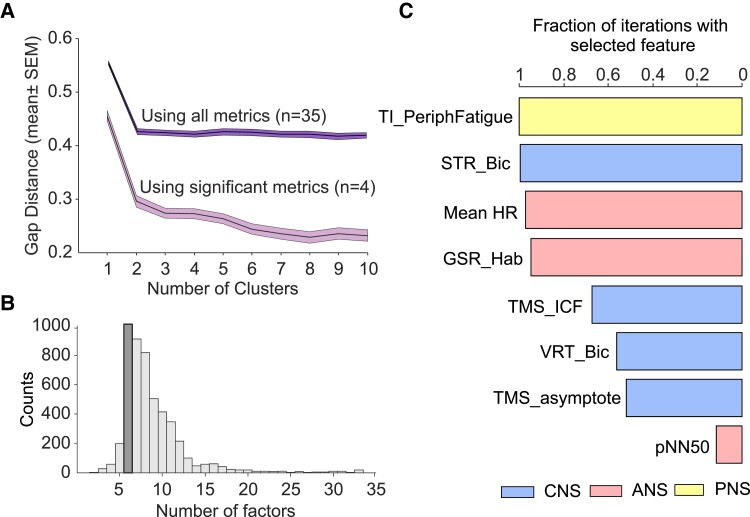
Figure 4.
Clustering and machine-learning analysis. (A) Gap analysis of number of clusters in the multivariate data set from pCF subjects. This is the result of 100 iterations. (B) Number of factors chosen by a machine-learning algorithm to maximize classification of pCF versus control subjects during 5000 iterations. (C) Fraction of iterations (n = 5000) of classification algorithm, with feature number fixed to 6, which included different features. Plot has been truncated to show the most common eight features.

