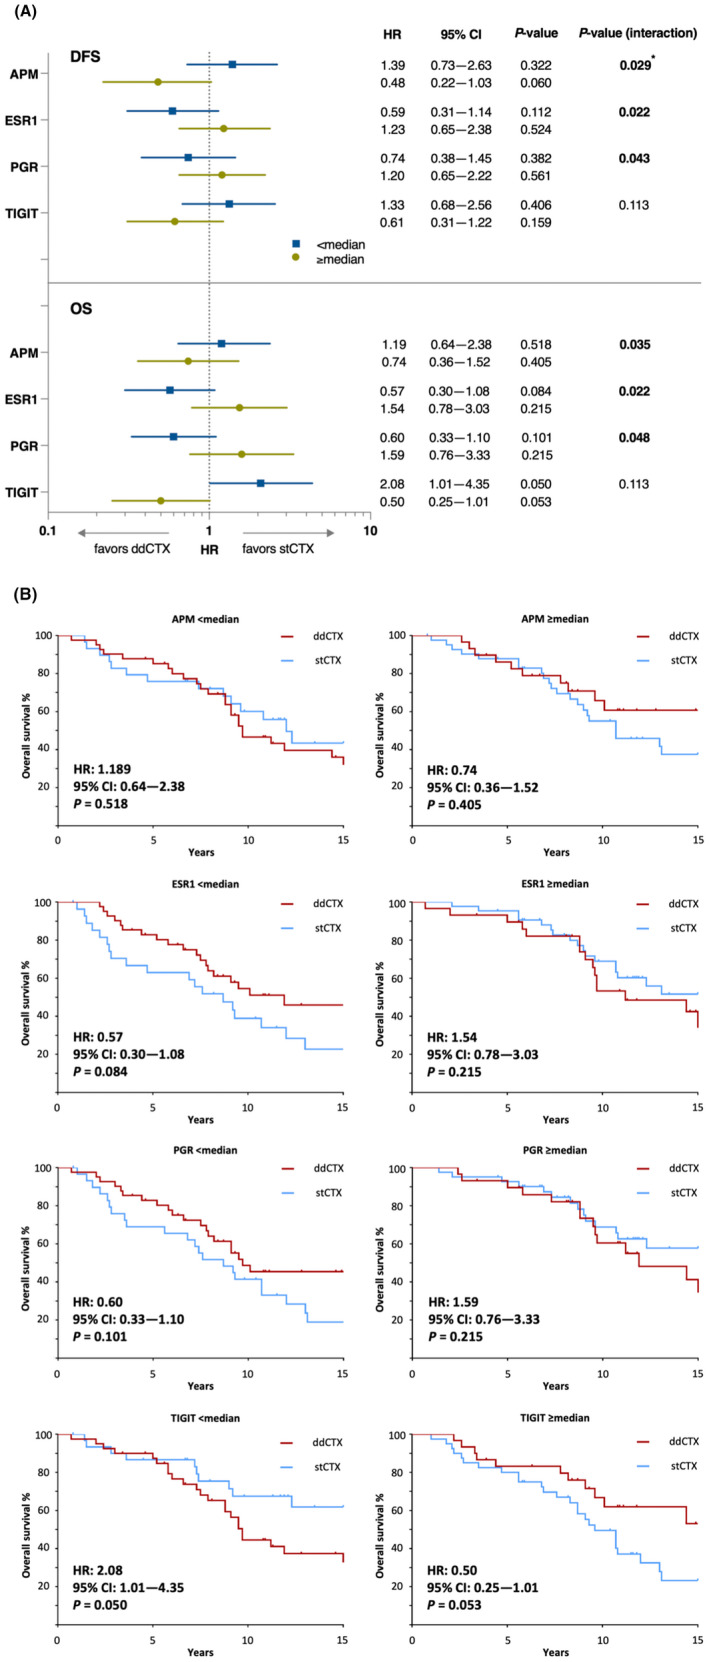
Fig. 2.

Predictive analysis for interaction between genes/signature and treatment intensity identified APM, ESR1 and PGR as genes the expression of which (≥ median or < median) is associated with effectiveness of treatment. (A) ddCTX was associated with a better treatment effect in tumors that had low (< median) expression of ESR1 or PGR and high (≥ median) expression of APM. (B) These trends appear to be reflected in Kaplan–Meier analysis of OS although the differences between both treatments were not statistically significant. Although difference in OS was the strongest for TIGIT expression, the genes/signature‐by‐treatment effect was not statistically significant. Multivariate analyses were performed only for variables with significant unadjusted P values either for treatment‐by‐gene/signature interaction or for treatment effect within a gene/signature subgroup. Kaplan–Meier survival curves were analyzed using Cox regression analysis and Wald test. Statistically significant associations are shown in bold. Asterisk (*) indicates statistical significance after multivariate analysis. APM, antigen processing machinery; CI, confidence interval; ddCTX, dose‐dense chemotherapy; PFS, progression‐free survival; ESR1, estrogen receptor‐1; HR, hazard ratio; OS, overall survival; PGR, progesterone receptor; stCTX, standard‐dosed chemotherapy; TIGIT, T‐cell immunoreceptor with immunoglobulin and immunoreceptor tyrosine‐based inhibition motif domains.
