
Fig. 2.
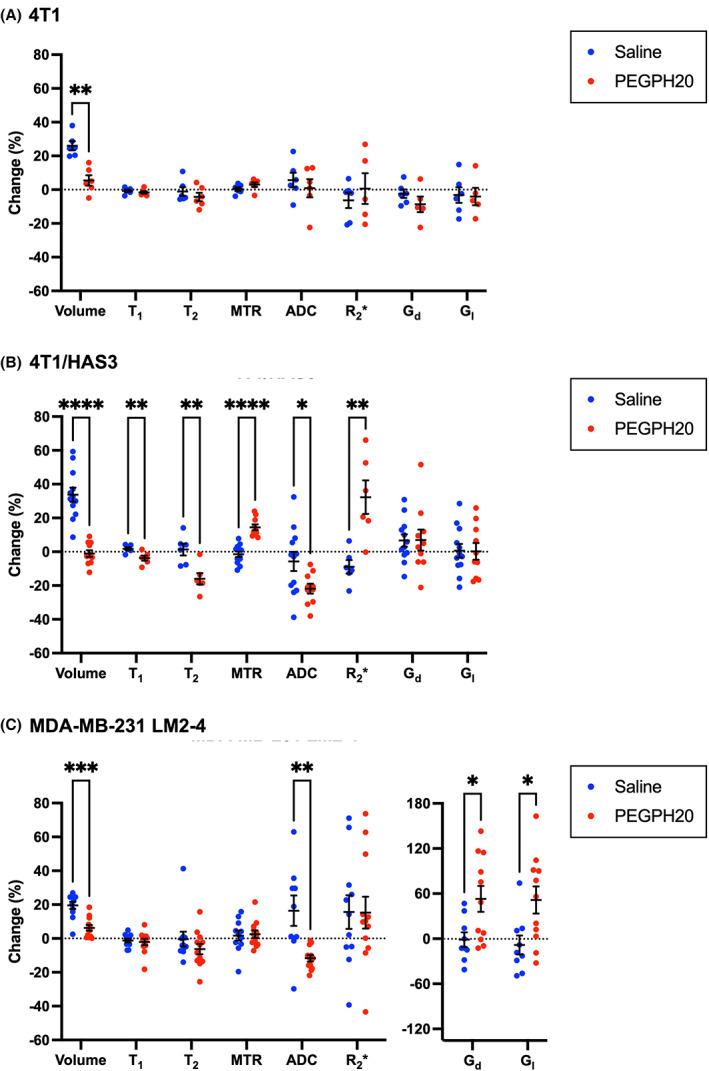
Changes in the quantitative volumetric and multiparametric MRI data following treatment with saline (blue) or PEGPH20 (red). Percentage change in tumour volume and MRI parameters between pre‐ and post‐treatment MRI for saline and PEGPH20‐treated mice bearing (A) 4T1, (B) 4T1/HAS3 or (C) MDA‐MB‐231 LM2‐4 tumours. PEGPH20 significantly reduced the growth of 4T1 (**q = 0.004), 4T1/HAS3 (****q < 0.0001) and MDA‐MB‐231 LM2‐4 (***q = 0.0005) tumours. PEGPH20 treatment did not significantly change the MRI biomarkers in 4T1 tumours (q > 0.05). PEGPH20 significantly reduced the longitudinal relaxation time (T1; **q = 0.01), transverse relaxation time (T2; **q = 0.006) and apparent diffusion coefficient (ADC; *q = 0.02), and significantly increased the magnetisation transfer ratio (MTR; ****q < 0.0001) and transverse relaxation rate (R2*; **q = 0.005) in 4T1/HAS3 tumours. PEGPH20 treatment of MDA‐MB‐231 LM2‐4 tumours significantly decreased ADC (**q = 0.007) and increased the elastic modulus (Gd; *q = 0.03) and viscous modulus (Gl; *q = 0.03). Data are the individual changes from median values of each tumour and the cohort mean ± 1 SEM. Sample sizes were: 4T1 saline n = 6 and PEGPH20 n = 6, 4T1/HAS3 saline n = 12 and PEGPH20 n = 12 (except for T1, T2 and R2* where saline n = 6 and PEGPH20 n = 6), and MDA‐MB‐231 LM2‐4 saline n = 11 and PEGPH20 n = 12. Multiple unpaired Student's t‐tests were conducted, and the resulting q value shown is the P‐value adjusted for the false discovery rate (FDR).