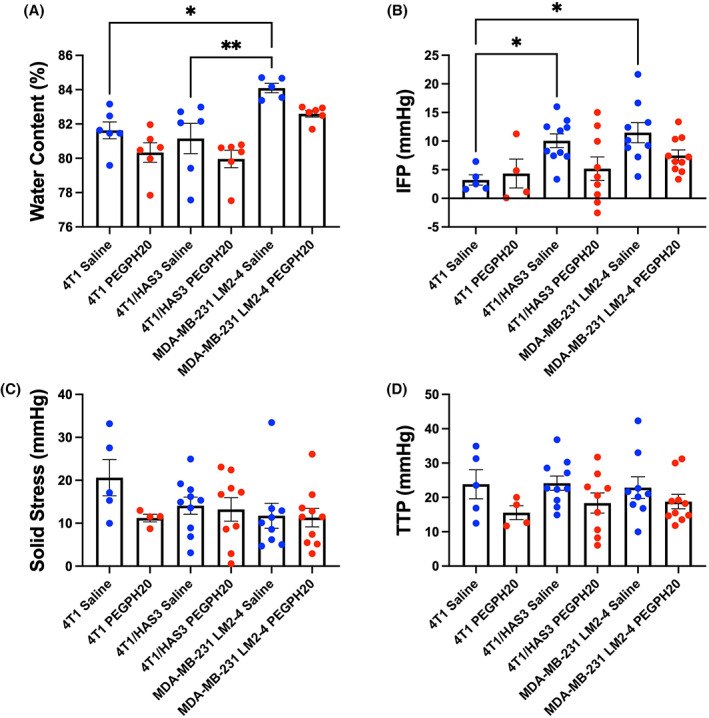
Fig. 3.

Differences between tumour models and the effect of PEGPH20 on tumour water content and pressure measurements. Tumour water content (A), interstitial fluid pressure (IFP) (B), solid stress (SS) (C) and total tissue pressure (TTP) (D) were measured from saline (blue) or PEGPH20 (red)‐treated 4T1, 4T1/HAS3 and MDA‐MB‐231 LM2‐4 tumours. MDA‐MB‐231 LM2‐4 tumours had higher water content than 4T1 (*P = 0.03, one‐way ANOVA with multiple comparisons) and 4T1/HAS3 tumours (**P = 0.006). Water content was measured ex vivo from one half of each tumour following post‐treatment MRI and tumour pressure measurements. IFP, SS and TTP were measured invasively in vivo following the post‐treatment MRI from one region within each tumour. 4T1 tumours had lower IFP compared to 4T1/HAS3 (*P = 0.05) and MDA‐MB‐231 LM2‐4 tumours (*P = 0.01). PEGPH20‐treated tumours did not have significantly different water content, IFP, SS, or TTP compared to saline controls in any of the three breast tumour models (ns; P > 0.05). Data are shown as one point for each tumour and are summarised by the cohort mean ± 1 SEM. For water content measurements: 4T1 saline n = 6 and PEGPH20 n = 6, 4T1/HAS3 saline n = 6 and PEGPH20 n = 6, and MDA‐MB‐231 LM2‐4 saline n = 5 and PEGPH20 n = 6. For IFP, SS and TTP measurements: 4T1 saline n = 5 and PEGPH20 n = 4, 4T1/HAS3 saline n = 10 and PEGPH20 n = 9, and MDA‐MB‐231 LM2‐4 saline n = 9 and PEGPH20 n = 10.
