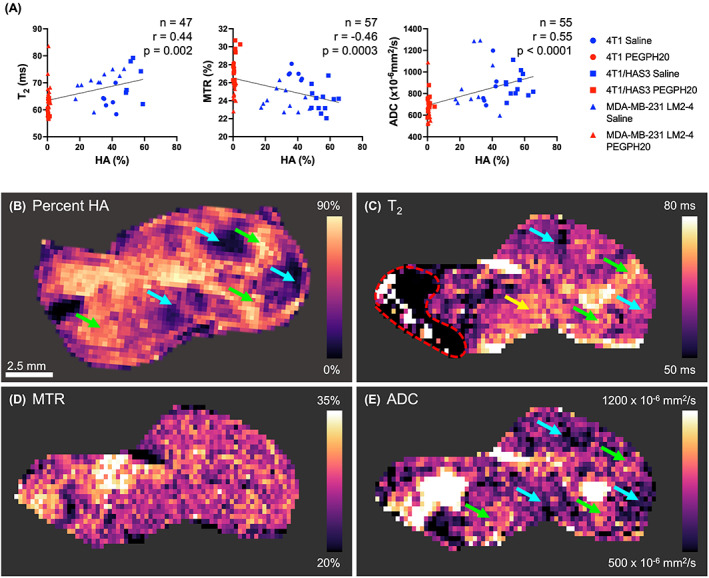
Fig. 6.

Inter‐ and intra‐tumour associations between MRI biomarkers and hyaluronan (HA). (A) Median values of MRI biomarkers were compared to percent HA (quantified from HTI‐601 staining) in saline (HA present; blue) and PEGPH20‐treated (HA degraded; red) 4T1, 4T1/HAS3, and MDA‐MB‐231 LM2‐4 breast tumours. Different shaped symbols indicate the different tumour models. The sample size (n), Pearson's correlation coefficient (r), and P‐value are shown by the linear regression they relate to. (B) An extracted parameter map from digital pathology of a whole tissue section stained for HA and processed to match the MRI resolution alongside aligned parametric maps of the (C) transverse relaxation time (T2), (D) magnetisation transfer ratio (MTR) and (E) apparent diffusion coefficient (ADC) for one saline control 4T1 tumour exhibiting intra‐tumour heterogeneity in HA accumulation. Green arrows highlight areas of high HA accumulation that corresponded to areas of high T2 and ADC. Blue arrows highlight regions of low HA related to areas of low T2 and ADC. Some regions of the T2 map appeared unrelated to HA accumulation (yellow arrow). MTR did not appear to have a spatial association with HA accumulation. The red dashed line indicates an artefact on the T2 map that was excluded from the analyses. The scale bar shown is 2.5 mm.
