
Fig. 7.
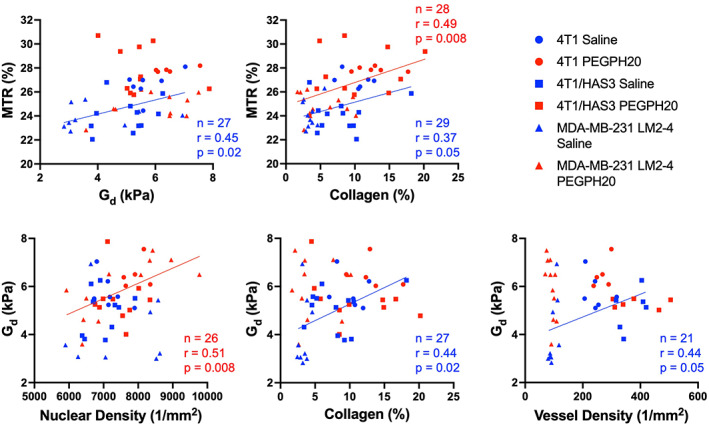
Relationships between the elastic modulus (Gd), magnetisation transfer ratio (MTR) and histological markers can differ in saline (hyaluronan/HA present) and PEGPH20‐treated (HA degraded) tumours. Linear regression plots summarising the relationships between median Gd, median MTR and quantitative histology are shown. Saline control and PEGPH20‐treated tumour data are shown in blue and red, respectively, with different shaped symbols indicating the three different breast tumour models. The sample size (n), Pearson's correlation coefficient (r), and P‐value are shown by the linear regression they relate to.