
Figure 2.
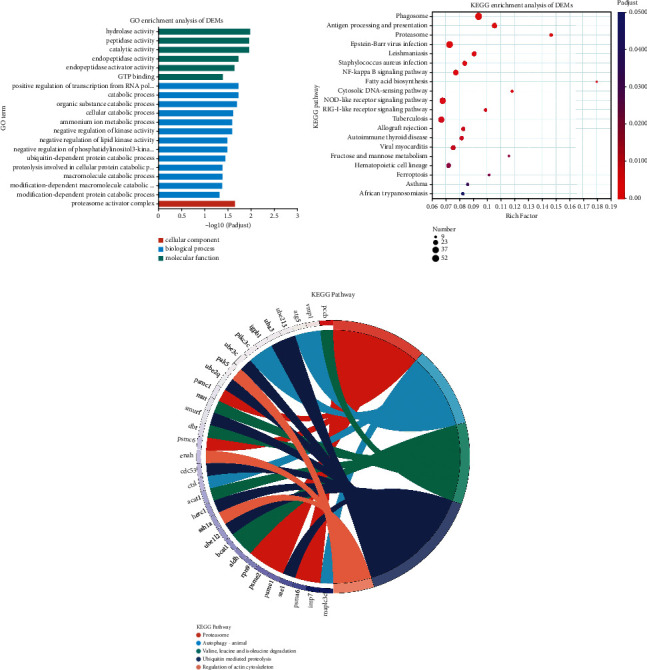
Enrichment and analysis of DEG pathways in GO and KEGG samples. (a) Statistics of the top 20 GO terms enriched for DEGs between two groups. The vertical axis represents GO terms, the horizontal axis represents the rich factors, and the size of the dot represents the number of genes correlated with the GO term. The color of the dot corresponds to different p-adjusted ranges, and the smaller the enrichment p-adjust, the greater the significance. (b) Top-20 KEGG enrichment results. The vertical axis represents the path name, and the horizontal axis represents the richly factor. The size of the dot indicates the number of genes in this pathway, and the color of the dot corresponds to different p-adjusted ranges. (c) KEGG pathway enrichment chord diagram. Red stands for proteasome; blue represents autophagy-animal; green represents valine, leucine, and isoleucine degradation; purple stands for ubiquitin-mediated proteolysis; and pink stands for regulation of actin cytoskeleton in the picture, which denotes a significantly enriched pathway corresponding to differentially expressed genes, with genes on the left. The smaller the log2FC, the greater the differential expression of multiple downregulated genes.