
Figure 4.
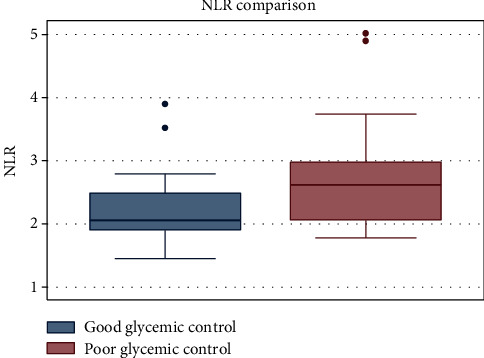
Box plot displaying the comparison of NLR value in the poor and good glycemic control groups.
Official websites use .gov
A
.gov website belongs to an official
government organization in the United States.
Secure .gov websites use HTTPS
A lock (
) or https:// means you've safely
connected to the .gov website. Share sensitive
information only on official, secure websites.
Box plot displaying the comparison of NLR value in the poor and good glycemic control groups.