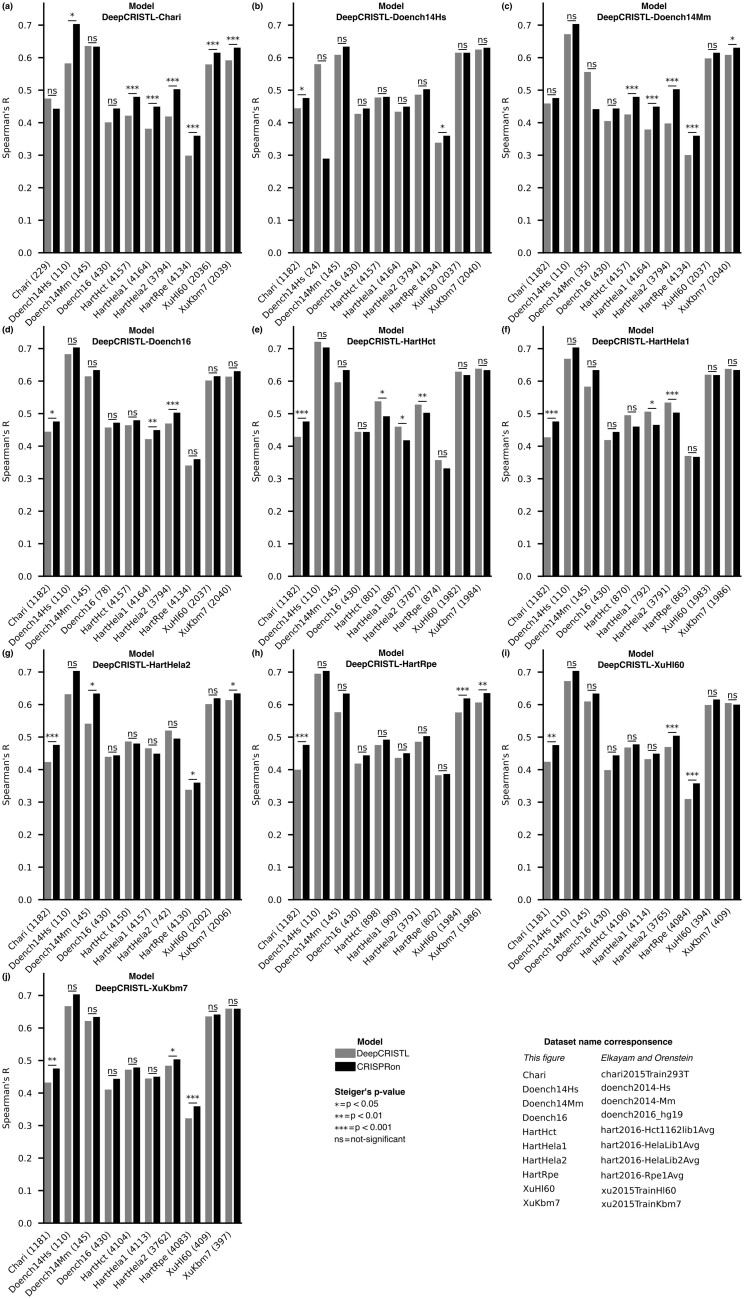
Figure 1.
Comparison between DeepCRISTL and CRISPRon. (a–j) The Spearman’s correlation between the experimentally determined and the predicted efficiencies (DeepCRISTL, grey and CRISPRon, black) is displayed with vertical bars, one for each test dataset (x-axis). The name of the DeepCRISTL model used in each comparison is reported on top of the corresponding barplot. The number of gRNAs in each test dataset, after removing the overlap with the datasets used for training, is shown in parenthesis. Two-sided Steiger’s test P-values are reported for each comparison. The datasets and model names have been shortened for visualization purposes; the correspondence with the original the dataset and model names is displayed in the legend.

