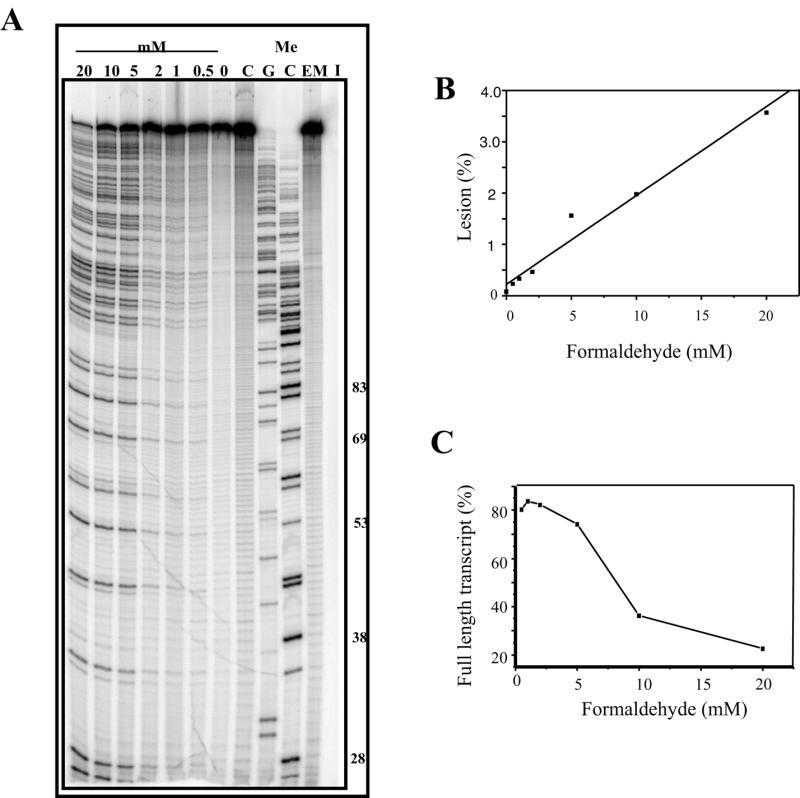
Figure 2.

Mitoxantrone-induced transcriptional blockages with increasing formaldehyde. (A) DNA (90 µM bp) was incubated with 20 µM mitoxantrone and formaldehyde (0–20 mM as indicated) in transcription buffer for 2 h. The samples were ethanol precipitated and resuspended in transcription reaction mix. Transcription was initiated at the lac UV5 promoter of the 512 bp fragment prior to transcript elongation for 5 min and denaturation in transcription termination buffer at 90°C for 5 min. The samples were then subjected to electrophoresis at 2000 V for 1.5 h on a 12% acrylamide gel. I is an initiation control which has not been elongated. C is an elongated control lacking mitoxantrone and EM is an elongated control representing undamaged DNA lacking both mitoxantrone and formaldehyde. MeC and MeG are sequencing lanes which were obtained using methylated nucleotides during elongation. The length of a range of MeC-terminated transcripts are shown to the right of the figure. (B) Quantitation of block sites from the gel shown in (A). The mole fraction of block site 4 (44mer) was calculated and plotted as a percentage of the entire lane at each formaldehyde concentration. (C) Quantitation of reduction in full-length transcript. The percentage of full-length transcript (A) is shown as a function of formaldehyde concentration.
