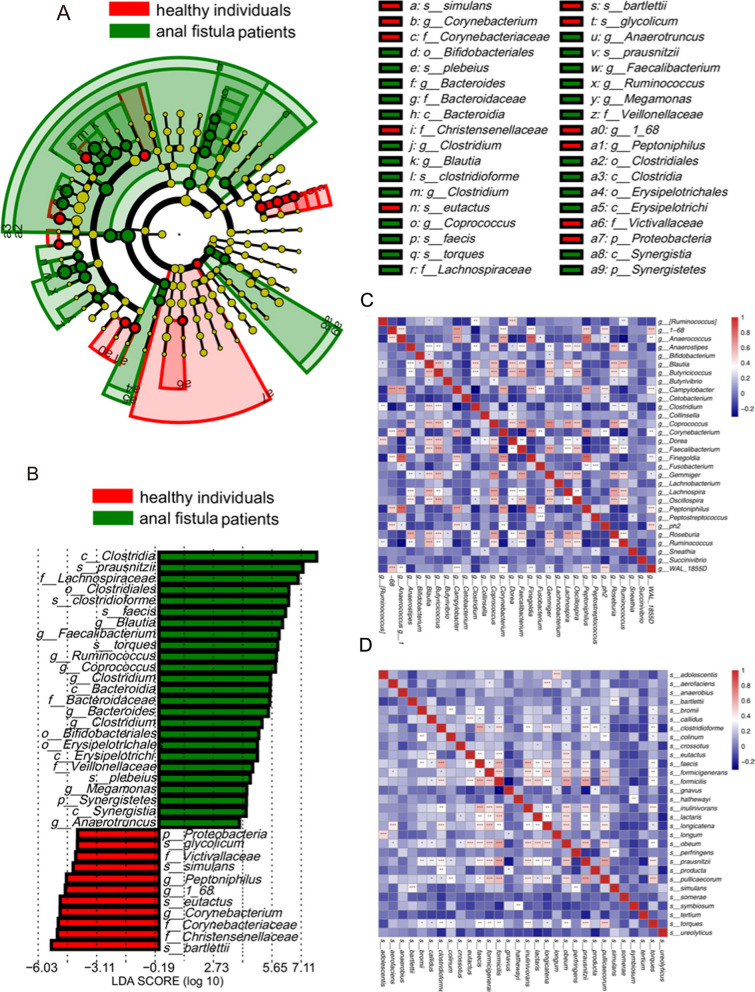
Fig. 3.
Differential microbiota of gut microbiome between anal fistula patients and healthy individuals. A The cladogram displays the taxonomic hierarchical structure of 36 discriminative biomarkers identified by the LEfSe analysis. B Barplots show the LDA score of 36 discriminative biomarkers. The color of bars represents the values of log10(LDA). The heatmap displays the spearman correlations among the top 30 most abundant genera (C) and species (D). *p-value < 0.05, ** p-value < 0.01, *** p-value < 0.001

