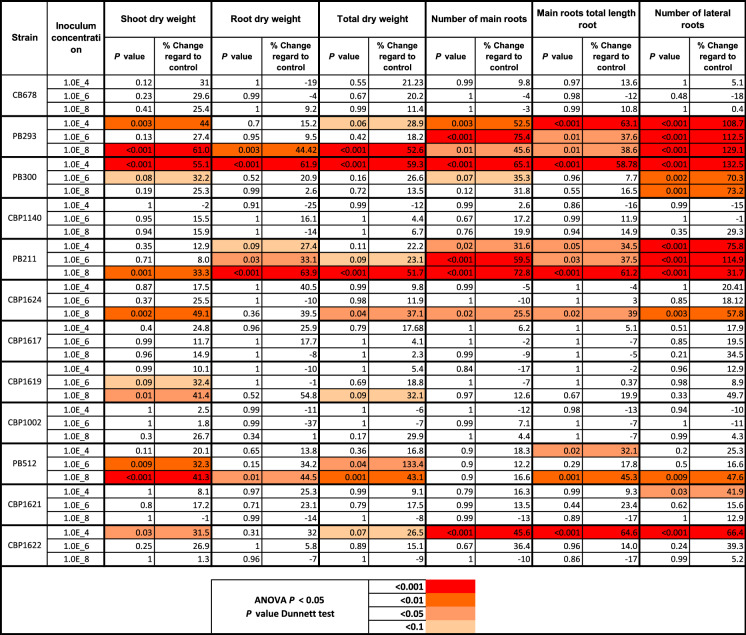
Table 1.
Effects of inoculating Lysinibacillus spp. strains on Zea mays ICA-109
The data were analyzed using the ANOVA test (P < 0.05). P values of the treatment's mean comparison with their respective control were calculated using Dunnett's test. Significative differences are labeled in color according to the scale in the bottom table. The mean percentage change of each treatment with its control also is presented. The box plots with the data distribution can be seen in Supplementary Material 1

