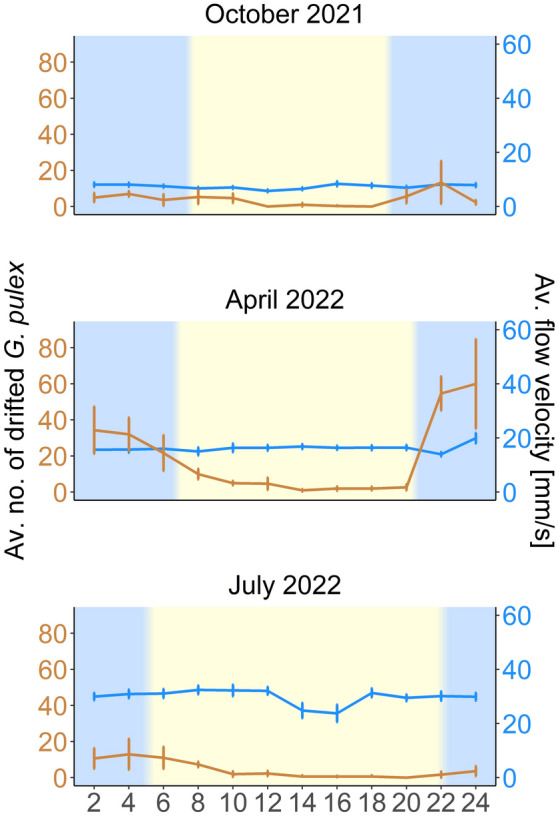
Figure 2.

Line plot showing the average number of drifted Gammarus pulex captured in two hours intervals (in orange, each temporal point represents the average number of amphipods collected during the prior two hours) and the measured average water flow velocity in mm/s (in blue), including the standard error. The bluish background indicates night, while the yellowish background and transition areas represent day and sunrise/sunset. Please note that the two y-axes differ in scale.
