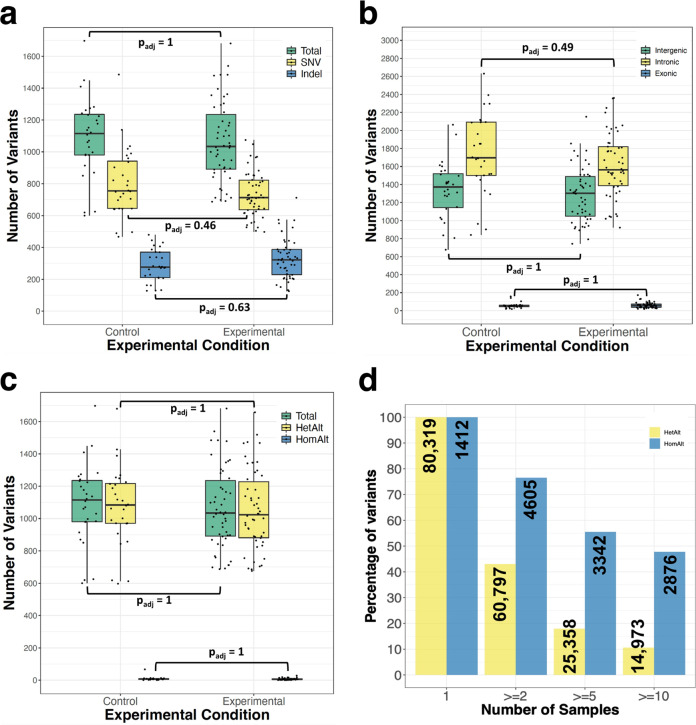
Fig. 2. Summary of variants detected in n = 28 biologically independent control and n = 50 biologically independent Cas9-edited experimental mice.
a Boxplots showing the total number of single nucleotide variants (SNV) and insertion-deletion (indel) variants identified within each experimental group. b Distribution of variants throughout the genome relative to genic sequences. c Zygosity of SNV and indel variants identified. d. Percentage of variants found in sample subsets. For boxplots: Lines within the boxes represent medians, lower edges the 1st quartile, and upper edges the 3rd quartile. The length of the box corresponds to the interquartile range (IQR). Whiskers extend to the minimum or maximum values that fall within 1.5 X IQR of the 1st and 3rd quartiles, respectively. Each datapoint represents the number of variants for a given sample. Statistical testing was done using Wilcoxon tests and Bonferroni corrections, evaluated at α = 0.05. HetAlt, heterozygous variant; HomAlt, homozygous variant.

