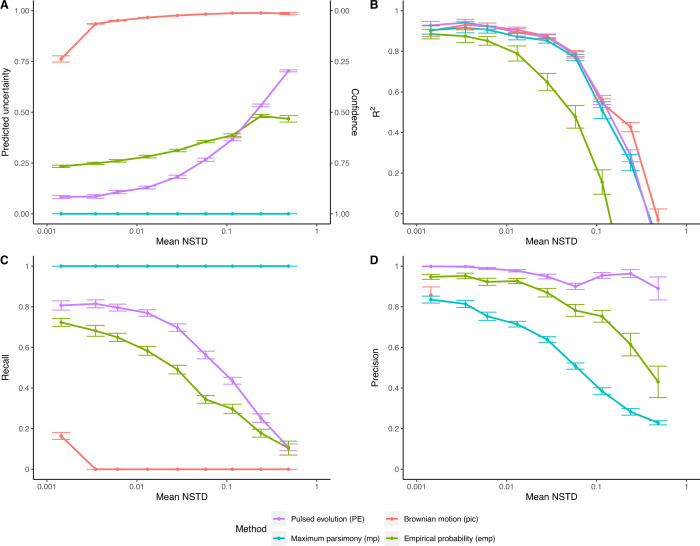
Fig. 2. The performance of prediction on empirical 16S GCN.
Using cross-validation of empirical data, the mean estimated uncertainty and confidence of predictions (A), the mean coefficient of determination R2 of the predictions (B), and the recall (C) and precision (D) of classification of predictions by their associated confidence estimate, plotted against the mean NSTD. The error bars represent the 95% CI of the mean. The empirical 16S GCN analyzed here are from the 6408 complete genomes in the reference phylogeny.

