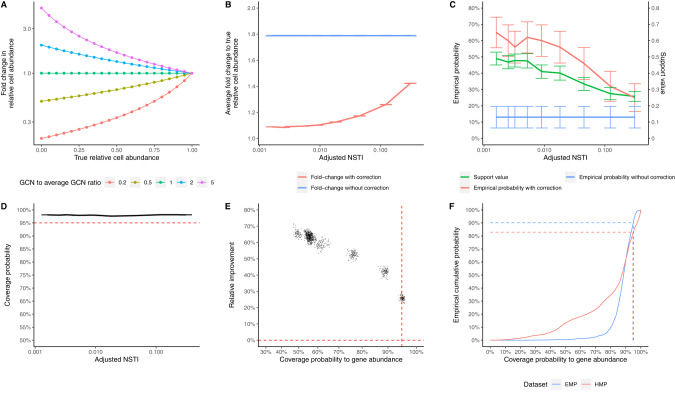
Fig. 3. The impact of 16S GCN variation on estimated relative cell abundances.
A The impact of GCN variation on estimated relative cell abundance based on theoretical calculations. The color of the lines denotes the ratio of an OTU’s GCN to the average GCN of the community. B The average fold change to the true relative cell abundance. C The empirical probability of correctly identifying the most abundant OTU in the community and the support value for the most abundant OTU. D The coverage probability of relative cell abundances’ estimated 95% CIs to the true relative cell abundance. Accurate confidence estimates (95% CIs) should produce a coverage probability of 95% regardless of the adjusted NSTI (dashed red line). E The correlation between the coverage probability to the relative gene abundance and the improvement by GCN correction. The horizontal red dashed line represents no improvement in relative cell abundance estimates; the vertical red dashed line represents 95% coverage probability to the relative gene abundance. The improvement is quantified by the relative reduction in the difference between the estimated and true cell abundances. F The empirical cumulative distribution of the coverage probability to the relative gene abundance in 2560 samples from the HMP1 dataset and 1856 samples from the EMP dataset. All error bars represent 95% CI of the mean.

