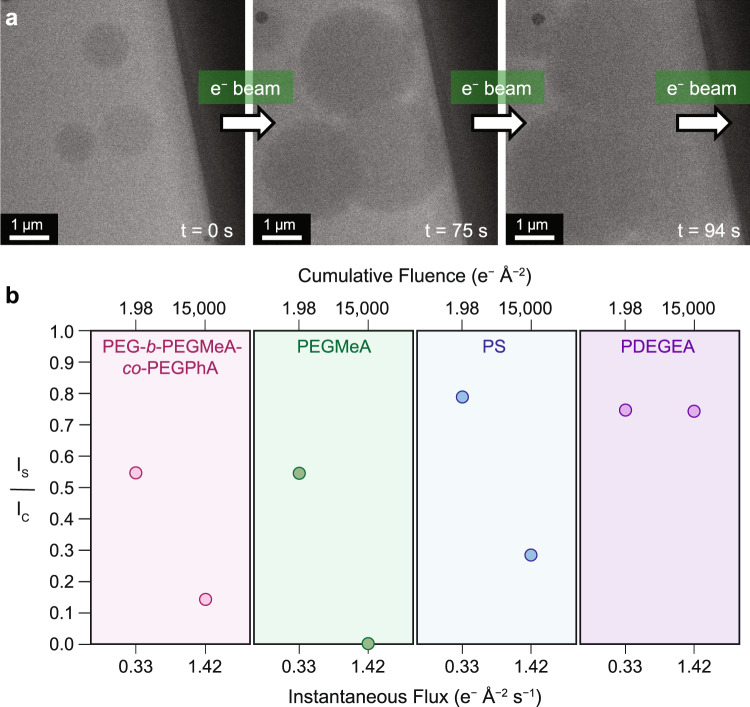
Fig. 2. Beam damage diagrams developed from LCTEM and MALDI-IMS analysis of PEG-b-PEGMeA-co-PEGPhA-b-PS triblock copolymer nanoassemblies.
a LCTEM experiment on PEG-b-PEGMeA-co-PEGPhA-b-PS continuously imaged at a flux of 1.42 e− Å−2 s−1. b MALDI-IMS damage plot where Is/ Ic is measured under different imaging conditions for different polymer damage experiments. Here, Is/ Ic denotes the ratio of imaged sample mass signal intensity (Is) over unimaged control mass signal intensity (Ic). The ratio Is/ Ic was plotted as a function of instantaneous flux and cumulative fluence. Three polymers were investigated for these MALDI-IMS damage studies: PEG-b-PEGMeA-co-PEGPhA, PDEGMeA, PDEGEA, and PS.

