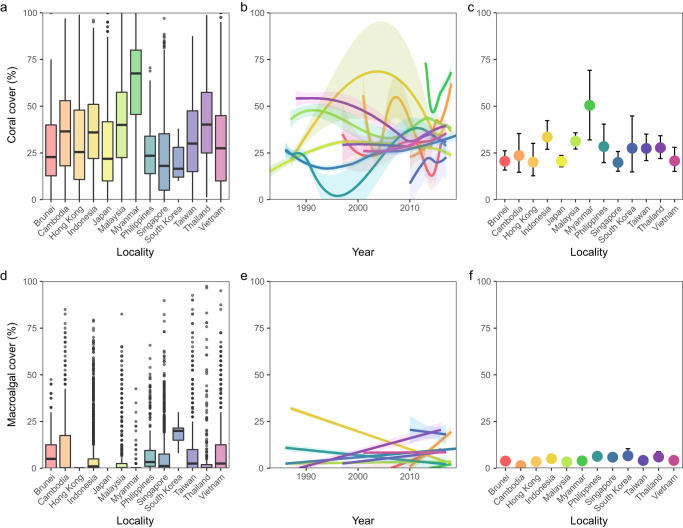
Fig. 3. Coral and macroalgal cover variations among reef localities.
a Boxplot of locality-level coral cover means. b LOESS coral cover means by locality through time. c Modelled Bayesian GAMM locality-level coefficients of coral cover. d Boxplot of locality-level macroalgal cover means. e GAM macroalgal cover means by locality through time. f Modelled Bayesian GAMM locality-level coefficients of macroalgal cover. Shaded regions represent the modelled credible intervals.

