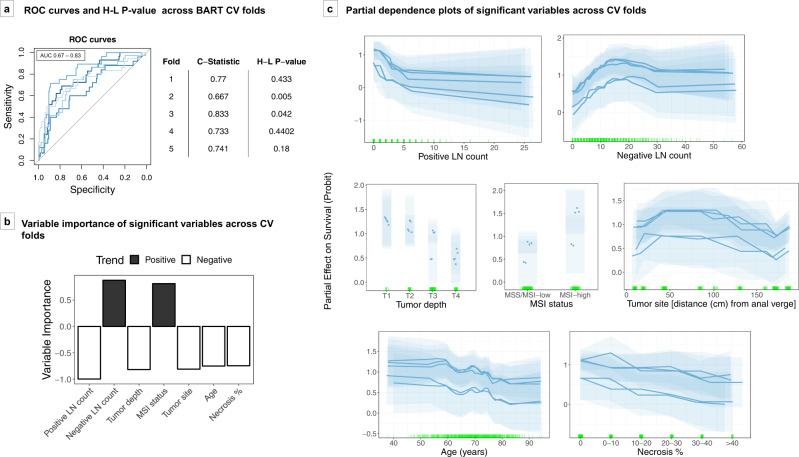
Fig. 3. BART stage II–III survival prediction model.
The BART prediction model was constructed based on seven significant and stable variables, namely positive and negative lymph node counts, depth of tumor invasion, microsatellite instability (MSI) status, tumor site, extraglandular necrosis, and age. a ROC curves and Hosmer–Lemeshow P values across fivefolds of cross-validation (CV). b Average variable importance across fivefolds of cross-validation, displayed in order of highest average importance. Black bars represent variables with positive trend with survival and white bars represent variables with negative trend with survival. c Partial dependence plots of significant variables across cross-validation folds. Each transparent block represents the 95% credible interval of one cross-validation fold based on 1000 posterior samples. Partial effects are plotted in terms of probability of survival on Probit scale. Darker lines and points represent the expected value of partial dependence for each variable across 1000 posterior samples. Green vertical hash marks on the X axis indicate observed data points used to generate the model. AUC area under the ROC curve, BART Bayesian additive regression trees, CV cross-validation, H-L Hosmer–Lemeshow, LNs lymph nodes, MSI microsatellite instability, MSS microsatellite stable, ROC receiver operating characteristics.

