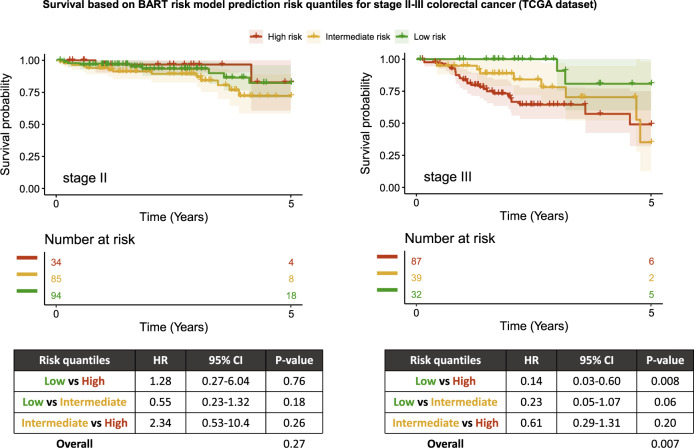
Fig. 6. Stage-specific Kaplan–Meier plots for survival in TCGA dataset.
Survival plots are shown for patients with stage II (left) and stage III (right) colorectal cancer in TCGA dataset, based on risk quantiles derived from predicted probabilities generated by the BART risk model. Table shows Cox proportional hazards model using risk quantiles and overall P value by log-rank test. BART Bayesian additive regression trees, CI confidence interval, HR hazard ratio.

