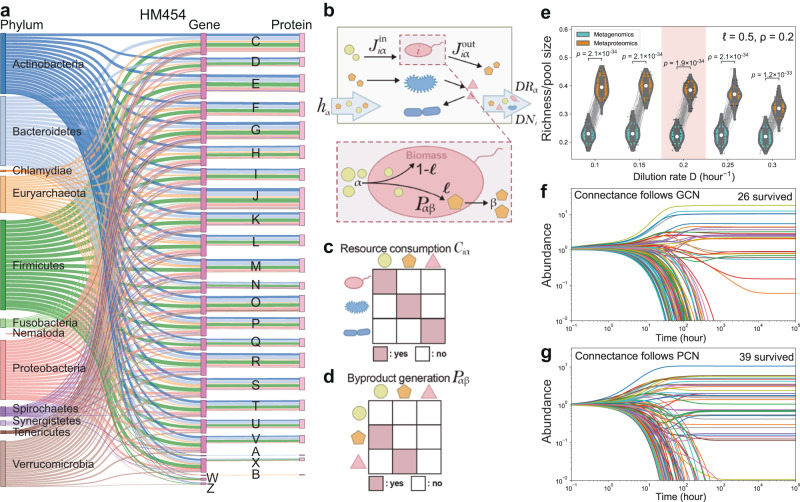
Fig. 2. Topology of proteomic content networks (PCNs) implies high richness.
a A tripartite plot derived from GCN and PCN in microbiome HM454. Letters represent different functional categories in the Clusters of Orthologous Groups (COGs) database. Results of the other microbiomes are shown in Supplementary Figs. S5–S7. b Schematic of Consumer-Resource Model with cross-feeding. The community is assumed with nutrient supply and dilution rate of resources and microbes for each resource and taxon-i. Each taxon-i converts incoming consumption flux into byproduct flux . A fraction of the incoming resource is converted into byproduct β, and fraction is assimilated into the biomass of taxon-i. c Resource consumption matrix describing the ability of taxon-i in consuming resource α. d Byproduct generation matrix describing conversion of a resource to a byproduct. Columns are consumed resources and rows are byproducts. e–g Effect of the variation of dilution rate on microbiome richness was simulated with consumption matrices with the same connectance as the GCN () or PCN (). The one pair of simulations (for GCN and PCN) in (e) were shown as (f, g). The default is dilution rate = , byproduct fraction = 0.5, and when 20 out of 100 nutrients are externally supplied (). Parameters for all panels are as follows: (e) = 0.5 and = 0.2; (f, g) D = , = 0.5, and = 0.2. Scattered dots and lines linking pairs of dots in (e) indicate each simulation paired between and . Middle white dot in the box plot denotes median, the lower and upper hinges correspond to the first and third quartiles, the black line ranges from the 1.5 × (interquartile range) below the lower hinge to 1.5 × IQR above the upper hinge, and whiskers represent the maximum and minimum, excluding outliers. **** indicate statistical significance at the p < 0.0001 levels by two-sided Mann–Whitney-Wilcoxon U Test with Bonferroni correction. N = 100 times of independent simulations. More simulations by altering other factors are shown in Supplementary Figs. S8–9.

