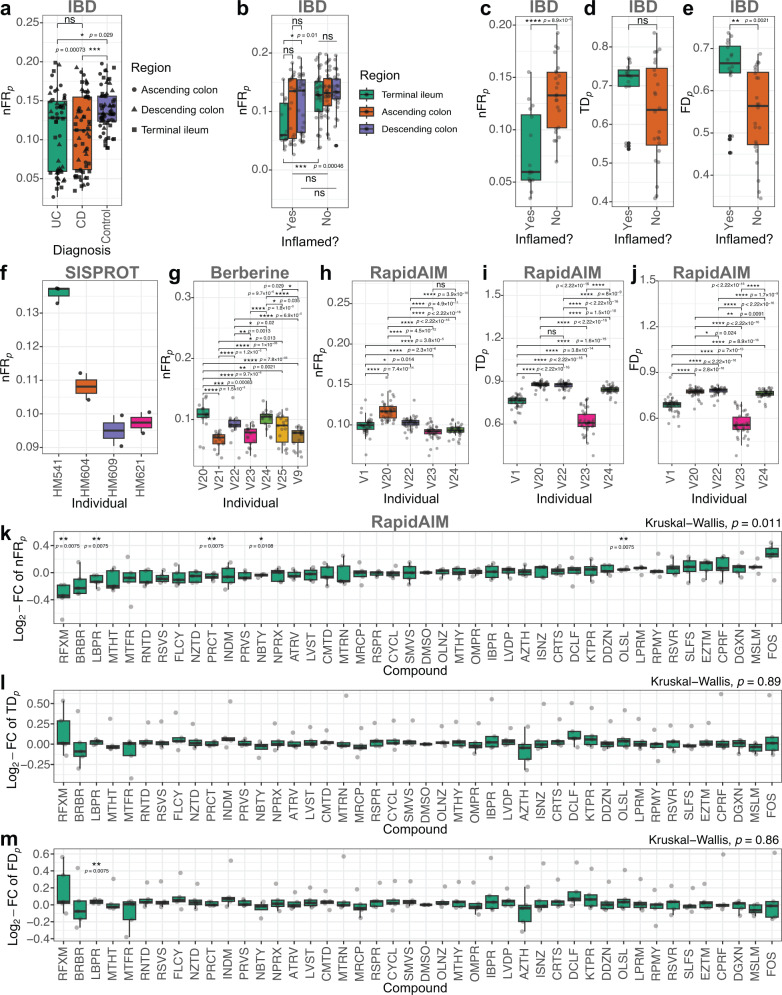
Fig. 5. Functional redundancy, taxonomic and functional diversity comparisons in different metaproteomics datasets.
a values by diagnosis in the IBD dataset, N numbers: N(UC) = 52, N(CD) = 61, N(Control) = 63 samples. b values by inflammation and gut region in the IBD dataset, N numbers: N(Ascending colon, inflamed) = 23, N(Descending colon, inflamed) = 28, N(Terminal ileum, inflamed) = 16, N(Ascending colon, non-inflamed) = 39, N(Descending colon, non-inflamed) = 30, N(Terminal ileum, non-inflamed) = 40 independent metaproteomic analyses. c Comparison of values between inflamed and not inflamed regions in TI of CD and control individuals. d Comparison of values between inflamed and not inflamed regions in TI of CD and control individuals. e Comparison of values between inflamed and not inflamed regions in TI of CD and control individuals. N numbers for C–E: N(inflamed) = 16, N(non-inflamed) = 24 independent metaproteomic analyses. f values by individual microbiomes in the SISPROT dataset. g values by individual microbiomes in the Berberine dataset, N numbers: N(V20) = N(V21) = N(V24) = 17, N(V9) = N(V22) = N(V23) = N(V25) = 18 compound treated or control microbiomes. h values by individual microbiomes in the RapidAIM dataset. i values by individual microbiomes in the RapidAIM dataset. j values by individual microbiomes in the RapidAIM dataset. k Log2-fold change (FC) of values in comparison to DMSO control samples of each individual (RapidAIM dataset). N numbers, (h–j): N(V1) = N(V20) = N(V22) = N(V24) = 44, N(V23) = 43 compound treated/control microbiomes per individual. l Log2-FC of values in comparison to DMSO control samples of each individual (RapidAIM dataset). m Log2-FC of values in comparison to DMSO control samples of each individual (RapidAIM dataset). N numbers, (k–m): N = 5 (with exception N(NBTY) = 4) biologically independent microbiomes. Significance of differences between-groups were examined by Wilcoxon rank-sum test (two-sided); *, **, *** and **** indicate statistical significance at the FDR-adjusted p < 0.05, 0.01, 0.001 and 0.0001 levels, respectively. In the box plots, each individual point represents a metaproteomic sample; lower and upper hinges correspond to the first and third quartiles, thick line in the box corresponds to the median, and whiskers represent the maximum and minimum, excluding outliers. In (k–m), Kruskall–Wallis test was also performed to detect whether there were significantly variations across all treatment/control groups. Source data are provided as a Source Data file.

