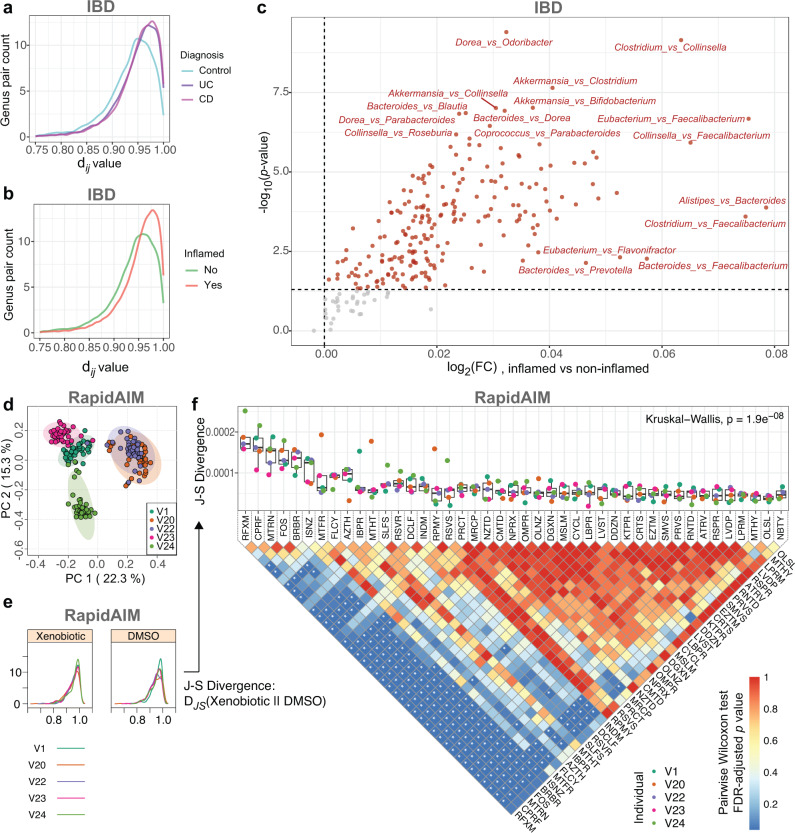
Fig. 6. Between-proteome functional distances in IBD and drug-treated microbiomes.
a Distribution of dij values by diagnosis. b Distribution of dij values by inflammation. c Volcano plot showing altered dij values between inflamed and non-inflamed sampling sites. The results were based on microbial genera of the top 95% overall protein biomass in the dataset. Wilcoxon rank-sum test (two-sided) was performed and p < 0.05 was selected as the threshold. d Principal component analysis based on between-genera functional distances in individual metaproteomes. e Scheme diagram of comparing the dij distribution between drug-treated microbiome and the DMSO control. f J-S divergence between the dij distribution in the control (DMSO) and that of the other compounds (lower and upper hinges correspond to the first and third quartiles, thick line in the box corresponds to the median, and whiskers represent the maximum and minimum, excluding outliers), N = 5 (with exception N(NBTY) = 4) biologically independent microbiomes. Kruskal–Wallis test result indicates that overall the compounds had heterogeneous levels of J-S divergence with the DMSO. Between-compound comparisons of the J-S divergence values were performed by a Pairwise Wilcoxon Rank-Sum Tests, * indicates statistical significance at the FDR-adjusted p < 0.05 level. The results were based on microbial genera of the top 95% overall protein biomass in the dataset. Source data are provided as a Source Data file.

