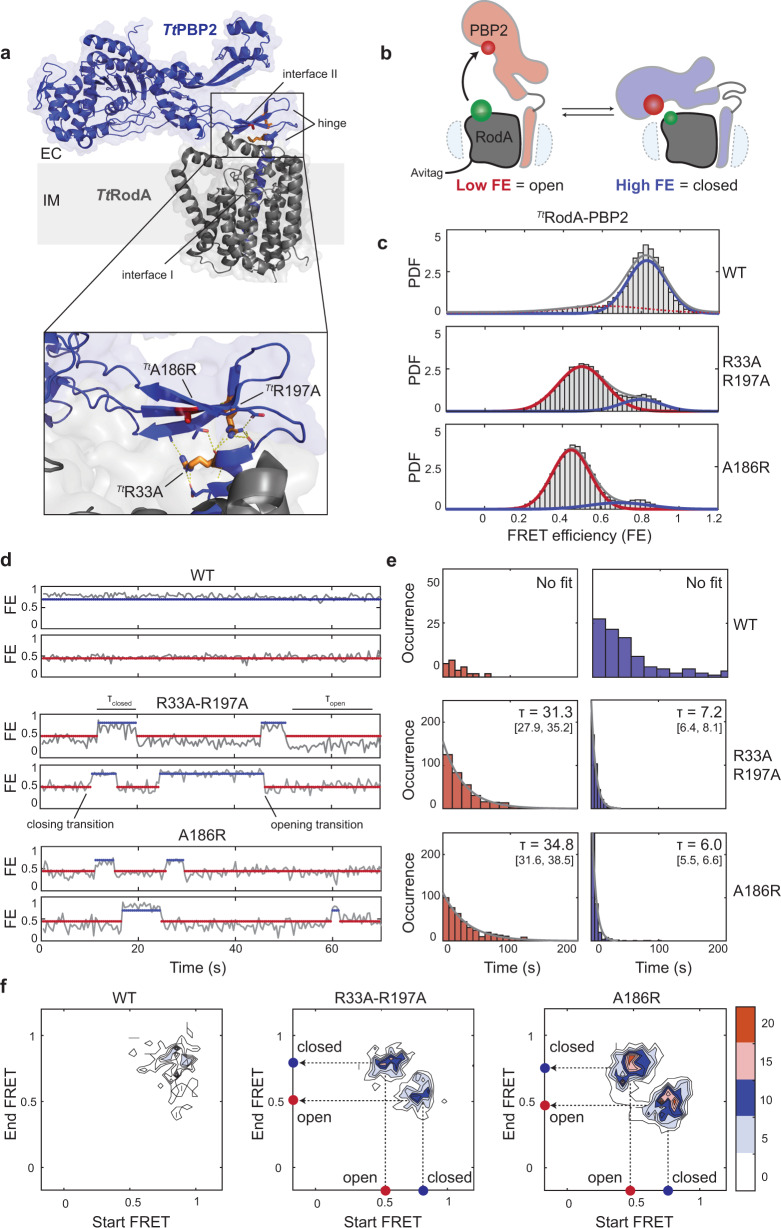
Fig. 1. smFRET analysis of TtRodA-PBP2WT and dynamic mutants.
a TtRodA-PBP2 X-ray structure (PDB: 6pl5) showing R33A, R197A (orange), and A186R (red) mutations as sticks; hydrogen bonds shown as dashed lines. The extracellular loop of RodA is omitted from the inset for clarity. b Schematic illustrating the smFRET assay, with one of the two possible orientations of donor (green) and acceptor (red) labels shown for simplicity. In the closed state, the labels are within 30–40 Å, which leads to high FRET efficiency (FE), while an increase in distance between labels upon structural opening leads to a decrease in FE. c Probability density (PDF) histograms of FE values derived from single-molecule trajectories for TtWT, TtR33A-R197A, and TtA186R (pSI7, pSI12, pSI13). Normal fits to the data are shown in red (low-FRET), blue (high-FRET), and gray (compound), assuming a two-state model. d Representative trajectories from (c), showing transitions between low-FRET (red) and high-FRET (blue) states. Markers are plotted at the mean values of the states as in Supplementary Table 1. e Dwell-time histograms and exponential fits for the low-FRET (red) and high-FRET (blue) states. Mean dwell times alongside 95% confidence intervals for all populations are indicated on the plots. f Transition density plots, normalized to the total observation time, show the frequency of closing and opening transitions for imaging constructs.

