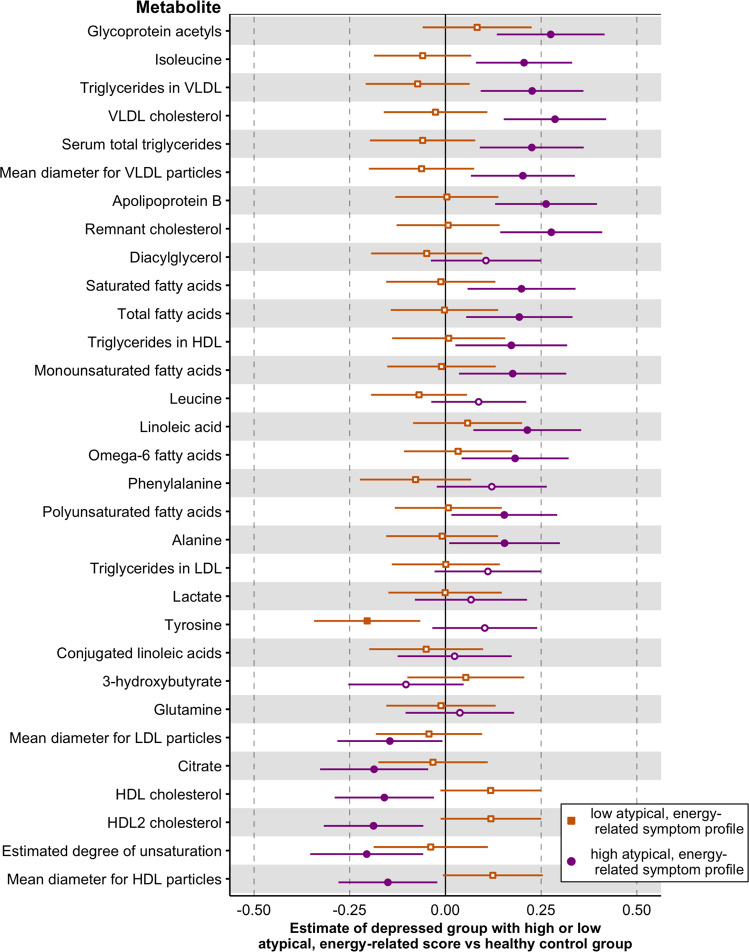
Fig. 3. Metabolite levels difference of depressed cases with low and high atypical, energy-related symptom profiles versus healthy controls.
Estimated mean differences and 95% confidence intervals of metabolite levels from general linear model. Reference group: healthy controls. Depressed cases stratified in high (purple indicators) and low (orange indicators) atypical, energy-related symptom profile scores. Filled indicators indicate a significant difference (p < .05) from healthy controls.

