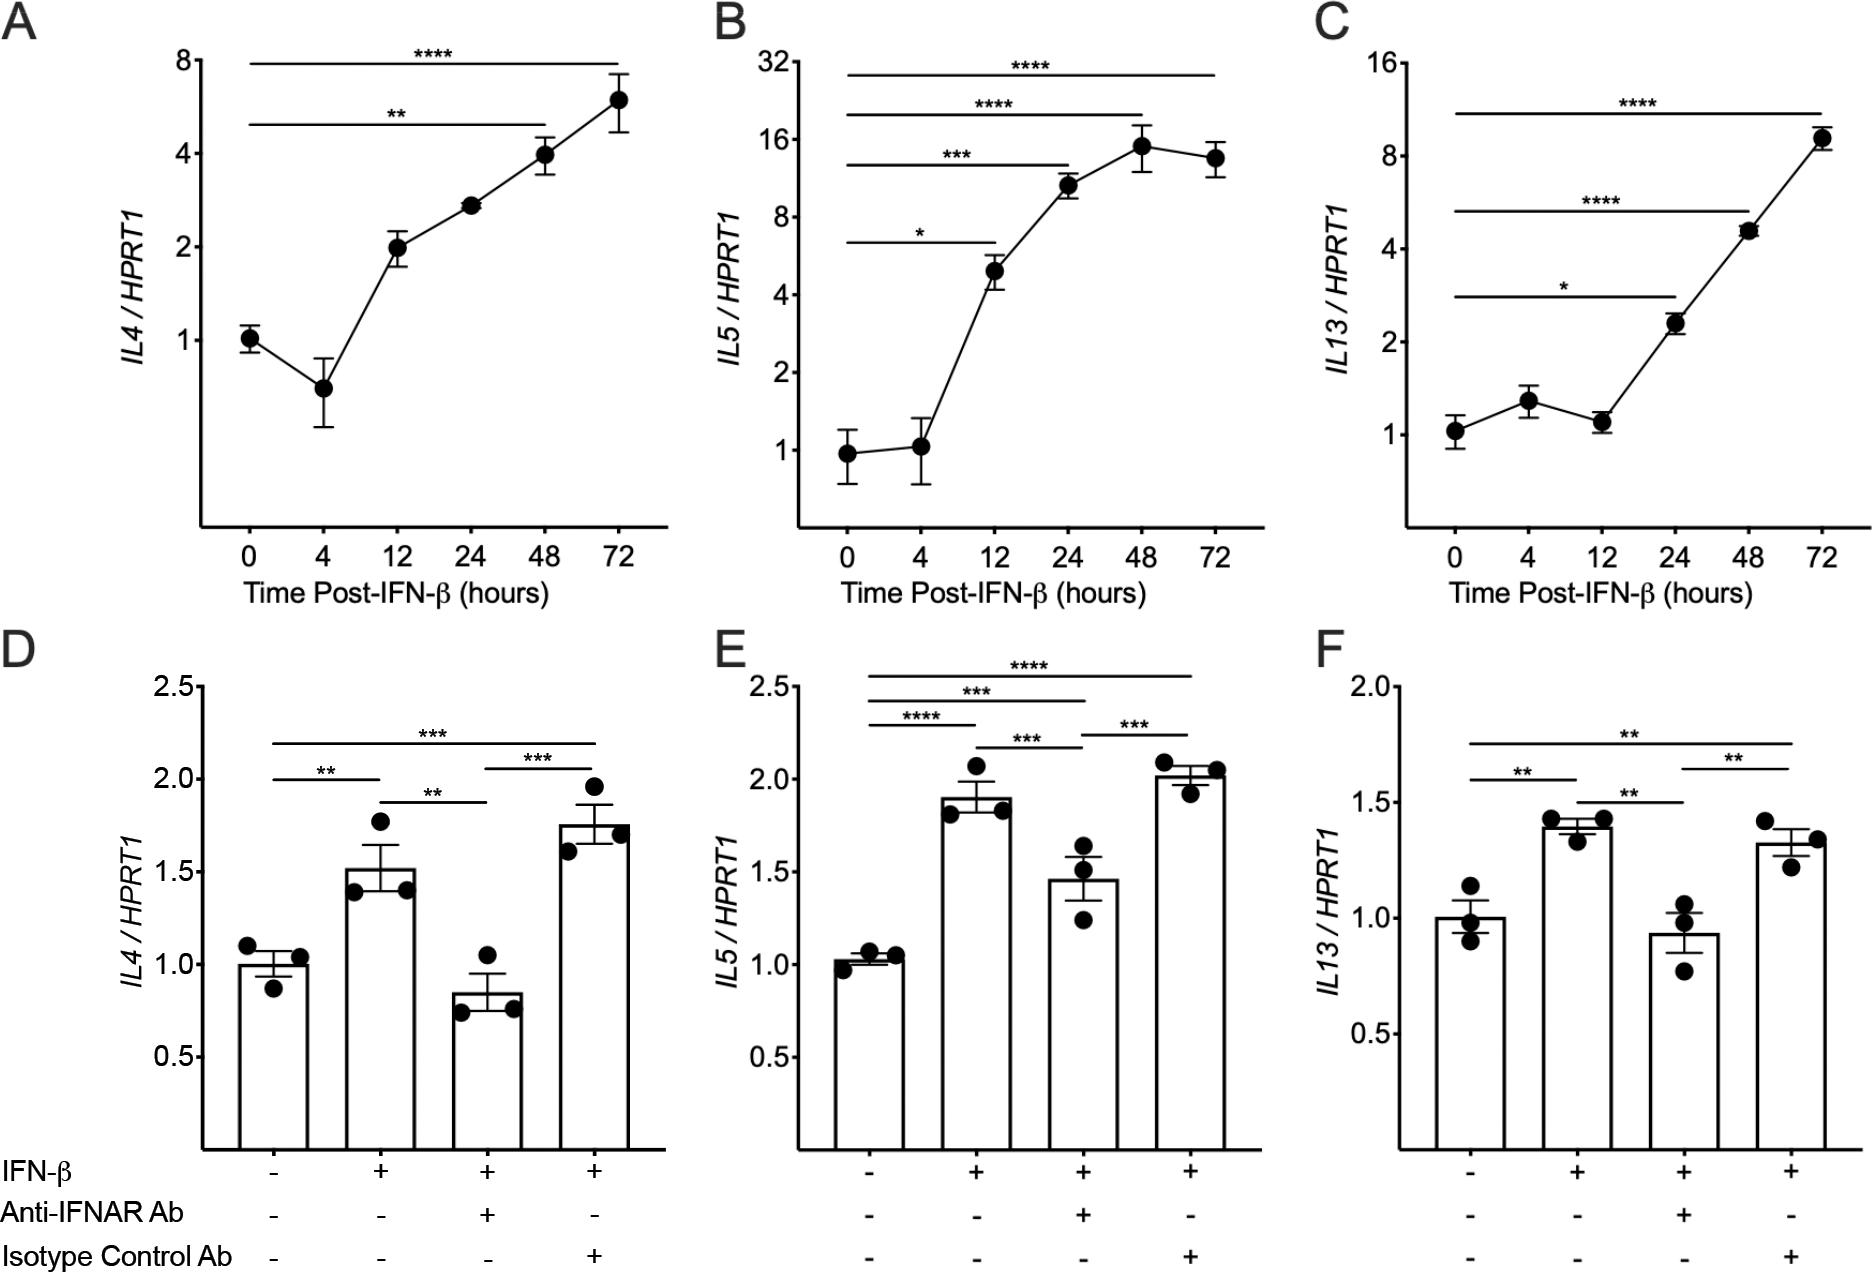
Figure 4.

IFN-β induces type-2 gene expression in mast cells (MCs). (A-C) PCR analysis was performed on Laboratory of Allergic Diseases-2 (LAD2) MCs stimulated with IFN-β1 (1 ng/mL) for 4, 12, 24, 48, and 72 hours. IL4 (A), IL5 (B), and IL13 (C) expression levels in comparison to the housekeeping gene HPRT1 (each data point represents the mean of three PCR reactions). Mean values are shown with error bars representing the standard error of the mean. (D-F) LAD2 MCs were stimulated with IFN-β1 (1 ng/mL) for 24 hours in the presence or absence of an anti-IFNAR antibody or isotype control antibody. IL4 (D), IL5 (E), and IL13 (F) expression levels in comparison to the housekeeping gene HPRT1 (each data point represents the mean of three PCR reactions). The P values in (A-F) are the result of a one-way ANOVA with correction for multiple comparisons using the 2-stage step-up method of Benjamini, Krieger, and Yekutieli. * indicates a P values <0.05, ** indicates a P value <0.01, *** indicates a P value <0.001, and **** indicates a P value <0.0001.
