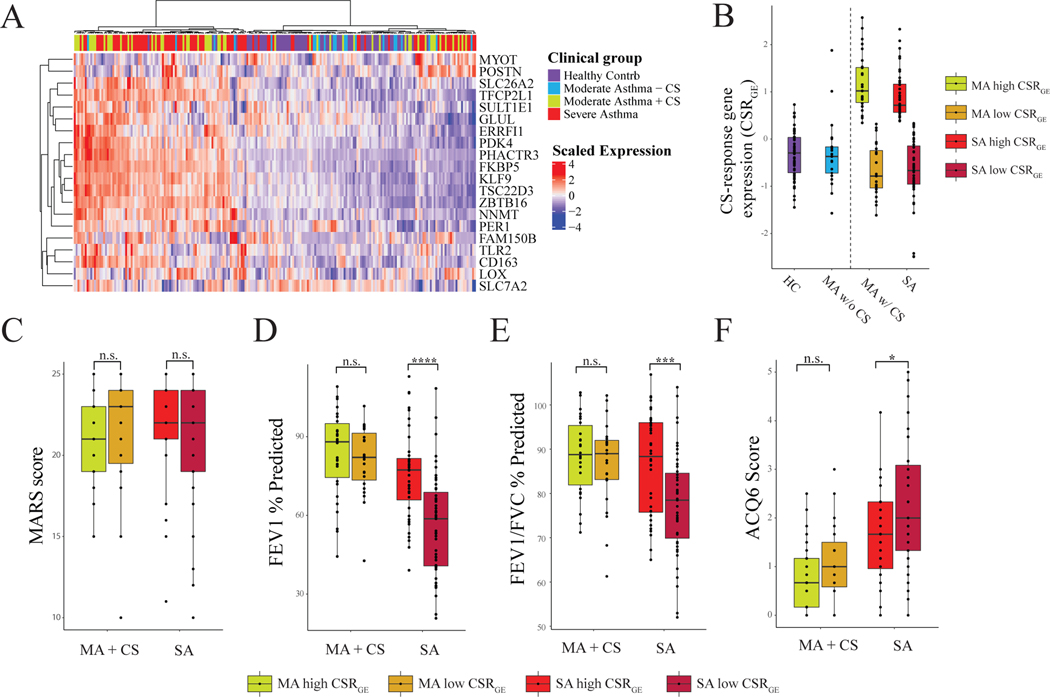
Figure 4: Heterogeneity in CSRGE Dictates Clinical Outcomes in SA.
(A) Heatmap showing clustering of patients for the combined IMSA+SARP dataset by the top 20 contributing genes to the two corticosteroid components (determined by taking the absolute value of the average contribution of each gene to the two components). (B) CSRGE for each diagnosis group, with Severe Asthma and Moderate Asthma with Corticosteroids split into high- and low- CSRGE groups. (C-F): Comparisons of clinical traits between high- and low- CSRGE groups. Statistics are performed with student’s t-test comparing high- and low- groups within each diagnosis group.

