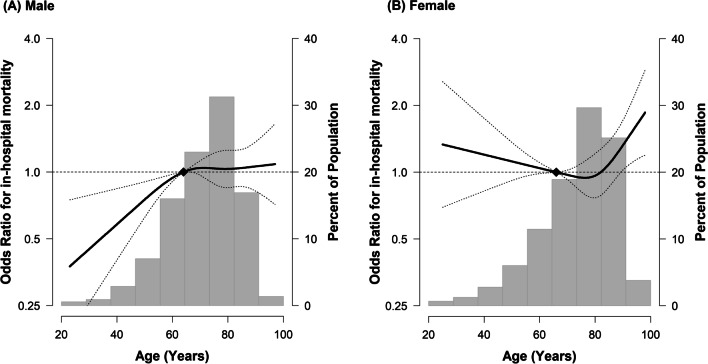
Fig. 2.
Multivariable-adjusted odds ratios (95% CI) for in-hospital death according to age in A male and B female. The curves represent adjusted odds ratios (solid line) and their 95% confidence intervals (dashed lines) for in-hospital death based on restricted cubic splines for age with knots at the 5th, 35th, 65th, and 95th percentiles of their sample distributions (male: 47.5, 68, 78, and 88, respectively, and female: 47, 71, 81, and 91, respectively). The reference value (diamond dot) is set at the 25th percentile (age 64 years for male, 66 years of female). The model is adjusted for age, Charlson comorbidity score (< 9 and ≥ 9), initial SOFA score, septic shock, site of infection, type of infection, ICU admission/transfer, and year

