
Figure 3. Lesion permeability analysis calculated from T1 contrast mapping reveals cumulative increase in gadolinium deposition with age.
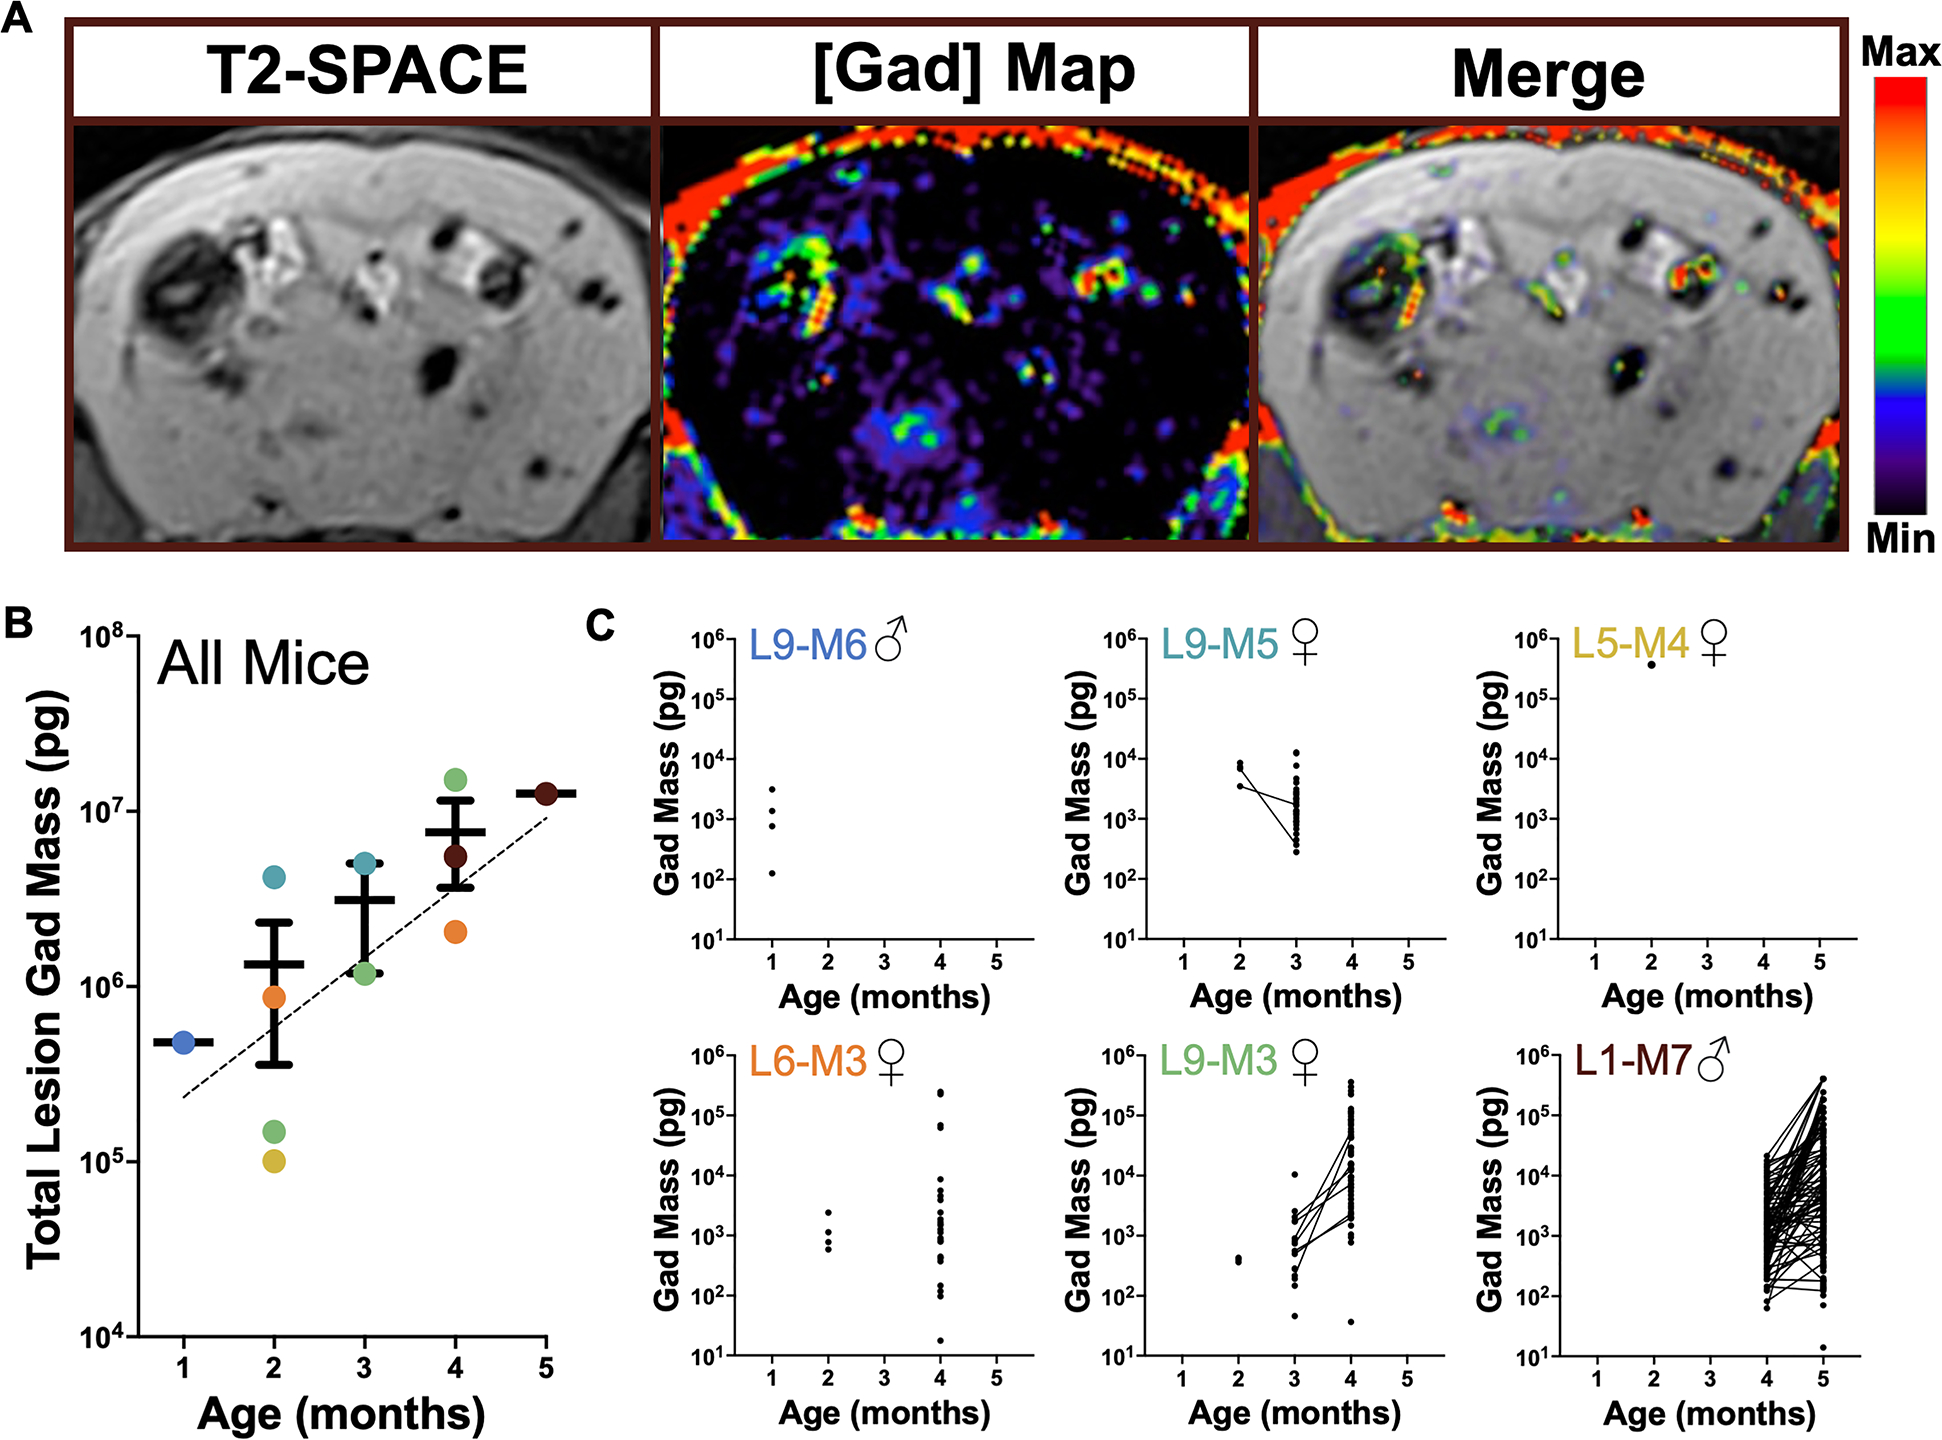
A, Representative MR images of T2-SPACE, a corresponding gadolinium concentration plot generated with T1 contrast mapping, and a merged image, illustrating leakiness of individual lesions in terms of gadolinium deposition. In the gadolinium concentration map, hyperintense areas (red) indicate regions with higher gadolinium deposition. B, A semilogarithmic graph of combined lesional gadolinium mass in each brain (n=6) over age. Individual mice are represented as single-colored dots, corresponding with the color of graph titles in panel C. The trend line shows the slope of the correlation (0.398±0.089 SEM, p=0.004) calculated with random coefficient regression analysis (Table S2). The bars represent means±SEM. C, Semilogarithmic graphs of gadolinium deposition in individual lesions, as a function of age, for each individual mouse in the cohort. Lines connect lesions identified as matched lesion across the imaging time points. Dots without connecting lines indicate de novo lesion formation or lesions that were only identified at a single time point. Graph titles indicate unique mouse ID where L# denotes litter number and M# denotes arbitrary mouse number within litter. Sex of mice is indicated with the symbol ♀ for females (n=4) and ♂ for males (n=2). Animated MRI sequences of L1-M7 are shown in Supplemental Videos S1–S3.