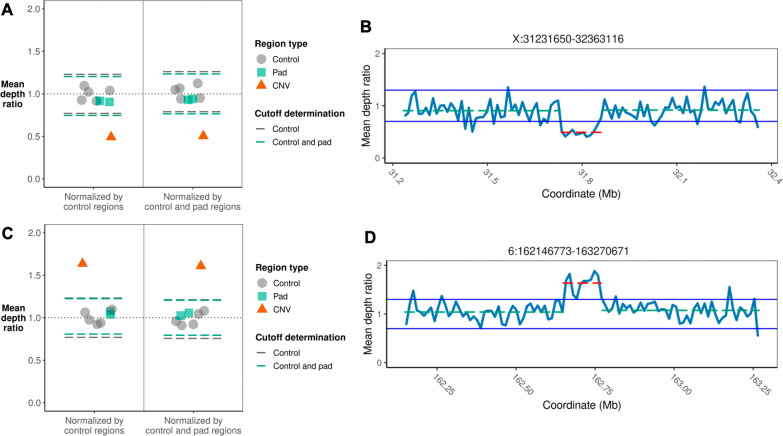
Fig. 2.
Examples of copy number variants (CNVs) identified by our pipeline. A Scatter plot of the regional mean depth for a Coriell sample (NA04099/SM4716) known to carry a deletion. A point was plotted for each of the five control regions, the two pad regions, and the deleted region. Each plotted point denotes the mean depth of the region normalized by either the mean depth across all control regions (left side of plot) or the mean depth across all control and pad regions (right side of plot). For each normalization approach, dashed lines are plotted to indicate three standard deviations from the mean of the normalized control regions (gray) and the normalized control and pad regions (green). B Read depth plot for a Coriell sample (NA04099/SM4716) known to carry a deletion. The mean depth in the deleted region was normalized by the mean depth across all control regions, calculated in non-overlapping windows that were 1% of the target size. The red dashed line indicates the mean depth ratio across the deleted region, and the green dashed lines indicate the mean depth ratios of the pad regions directly adjacent to the deleted region. C Scatter plot of the regional mean depth for a blood sample (Individual_5/SM7419) from a healthy individual known to carry a duplication. D Read depth plot for a blood sample (Individual_5/SM7419) from a healthy individual known to carry a duplication

