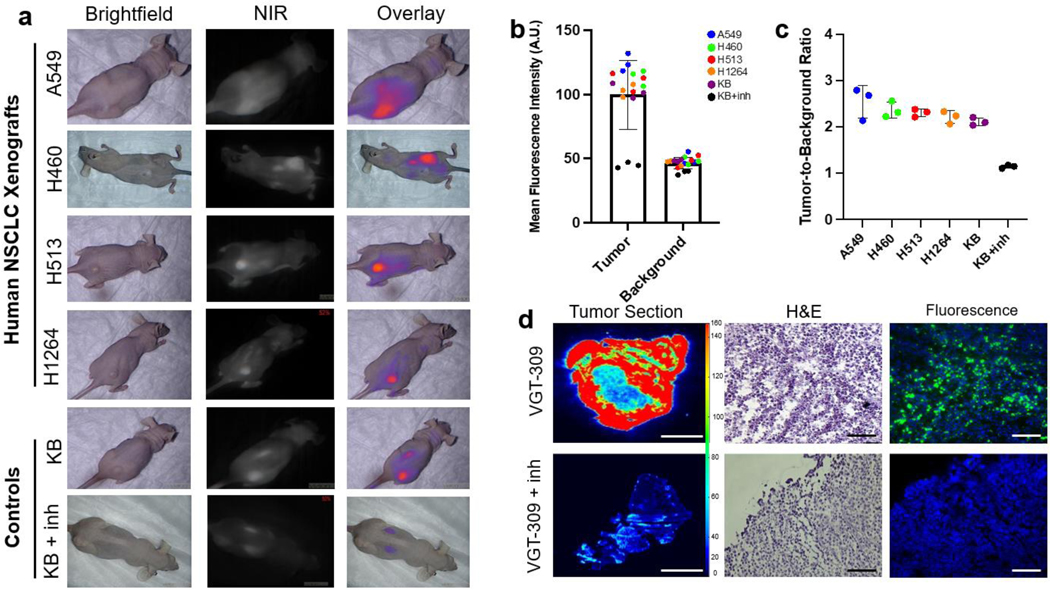
Figure 3.
VGT-309 labels human non-small cell lung cancer xenografts. a. Representative brightfield, near-infrared (NIR), and overlay images of mice bearing various NSCLC flank xenografts (n=3/cell line) 24 hours after injection of 2 mg/kg VGT-309. Mice bearing KB flank xenografts (n=3) pretreated with 50 mg/kg JPM-OEt via intraperitoneal injection for 5 days before VGT-309 administration served as a negative control and those pretreated with delivery vehicle (n=3) served as a positive control. b. Mean fluorescent intensity (MFI) of tumor and background tissue with symbol color indicating cell line. c. SBRs from the flank xenografts. Each point represents a single tumor with means and error bars displayed for each group. d. Correlative ex vivo histopathology and fluorescence microscopy of flank xenografts from mice without (top row) and with JPM-OEt pretreatment (bottom row). The leftmost column depicts heatmaps of macroscopic tumor fluorescence. The center column shows hematoxylin and eosin stained tissue slides. The rightmost column shows fluorescence microscopy. Green signal represents VGT-309 and blue signal shows DAPI staining. VGT-309 signal is absent in mice pretreated with a cathepsin inhibitor, demonstrating the cathepsin-activity dependence of VGT-309 fluorescence. Scale bars represent 50 μm.

