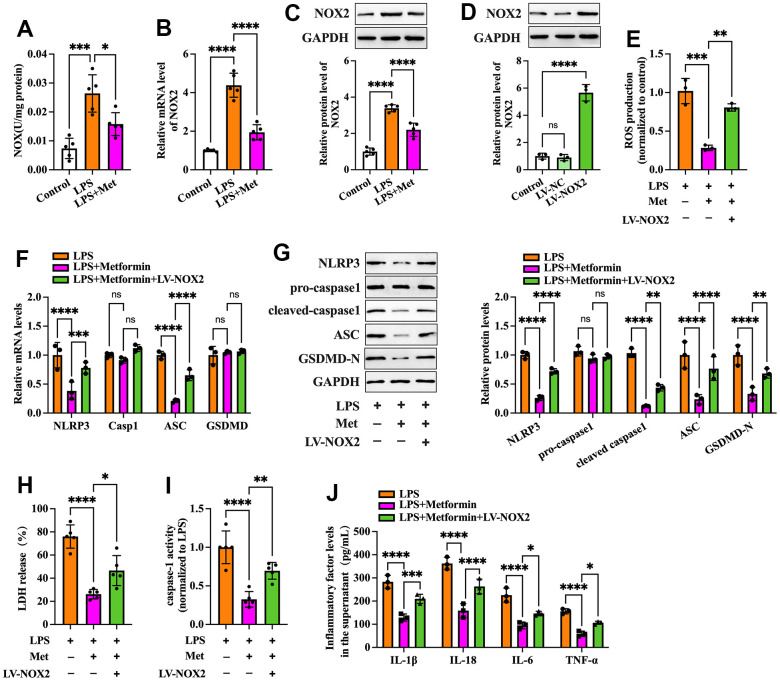
Figure 3.
Effects of NOX2 overexpression on the inhibitory effects of metformin on inflammation and KGN cell pyroptosis. (A–C) Cells were pretreated with or without 10 μM LPS for 24 h and then incubated with 20 μM metformin for another 12 h. (A) NOX activity was evaluated using a commercial NOX detection kit; (B) Quantification of NOX2 mRNA expression using RT-PCR; (C) Analysis of NOX2 protein levels using Western blotting; (D) Cells were transduced with PBS, LV-NC, or LV-NOX2 for 48 h. The transfection efficiency was evaluated using Western blot analysis; (E–J) Cells were pretreated with 10 μM LPS for 24 h or transfected with LV-NOX2 for 48 h and then incubated with 20 μM metformin for another 12 h; (E) Intracellular levels of ROS were measured using commercial kits; (F) The mRNA levels of NLRP3, ASC, caspase-1 and GSDMD were detected by RT-PCR; (G) The protein levels of NLRP3, pro-caspase-1, cleaved-caspase-1, ASC and GSDMD-N were detected by Western blot; (H) Levels of LDH in the cell culture medium were examined using an LDH cytotoxicity detection kit; (I) Caspase-1 activity was assessed using a colorimetric caspase-1 activity assay kit; (J) The levels of IL-1β, IL-18, IL-6, and TNF-α in the cell culture supernatant were determined by ELISA. Data are represented as the means ± SD from three independent experiments. *P < 0.05, **P < 0.01, ***P < 0.001, ****P < 0.0001, ns. not significant.

