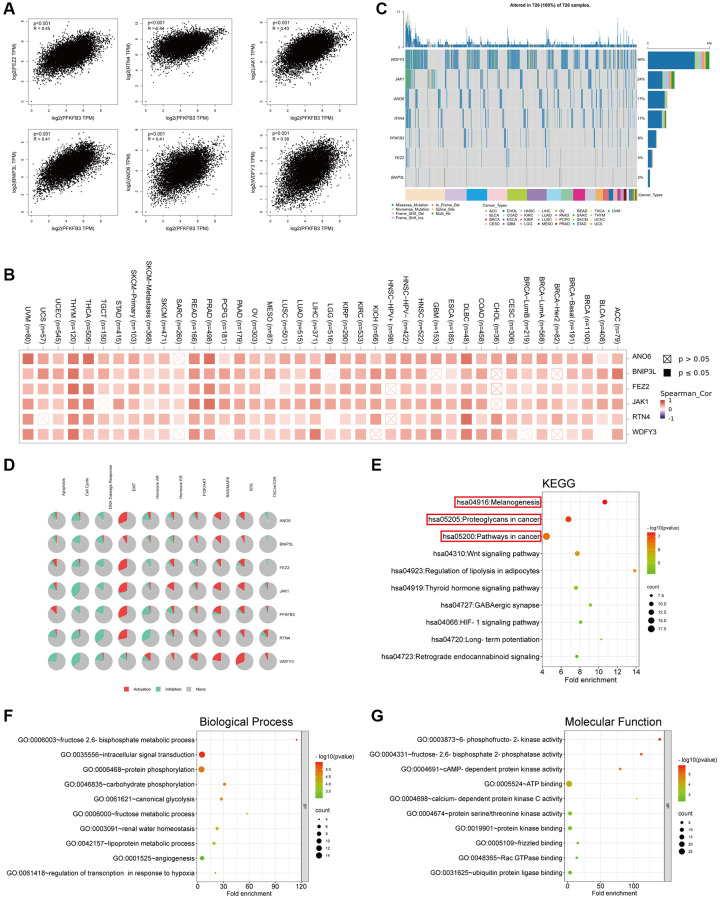
Figure 7.
Genes enrichment analysis of PFKFB3 in pan-cancer. (A) The association between PFKFB3 and representative genes among the top PFKFB3-related genes analyzed by GEPIA2 in pan-cancer. (B) Heatmap shows the correlation between PFKFB3 and selected genes in pan-cancer. (C) Single Nucleotide Variation (SNV) frequency analysis of selected genes in pan-cancer. (D) Pathway activity analysis of selected genes in pan-cancer. (E) KEGG pathway analysis of PFKFB3-binding proteins and PFKFB3-correlated gene. (F, G) Go analysis of PFKFB3-binding proteins and PFKFB3-correlated gene, biological process (F), molecular function (G).

