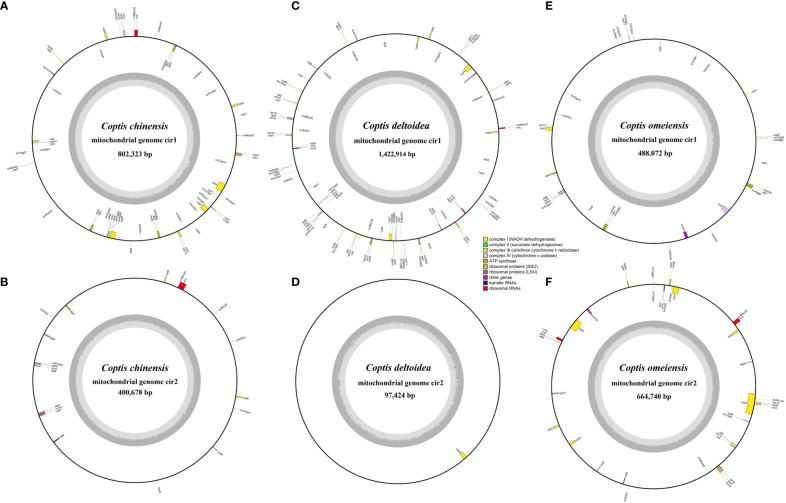
Figure 2.
Circular gene map of three Coptis mitogenomes. (A, B) The two large molecules of C. chinensis mitogenome. (C, D) The circular map of two molecules of C. deltoidea mitogenome. (E, F) The circular map of two molecules of C. omeiensis mitogenome. Genes shown on the outside and inside of the circle are transcribed clockwise and counterclockwise, respectively. The dark gray region in the inner circle represents GC content.

