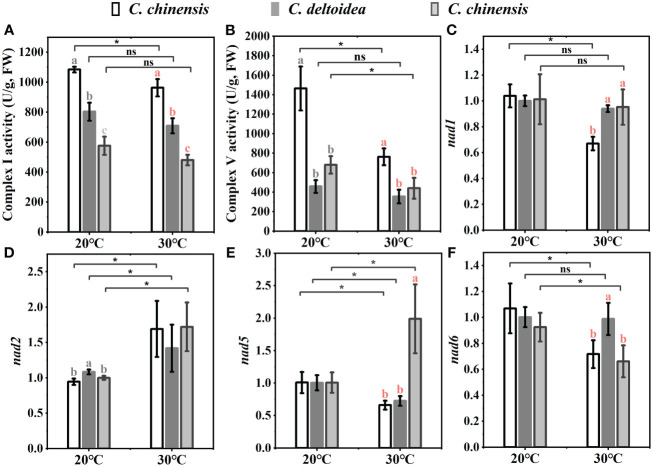
Figure 6.
The activities of complex I (A) and complex V (B), and the expressions of some PCGs involved in oxidative phosphorylation (C–F) of three Coptis species under 20°C and 30°C. Different letters with different color (gray and red) indicate a significant difference at P < 0.05 between three Coptis species under 20°C and 30°C, respectively. The asterisks indicate a significant difference between plants grown at 20°C and 30°C as determined by Student’s t-test (*p < 0.05, **p < 0.01) and ns means no difference between the treatment. Each column represents the mean ± standard deviation of three replicates.

