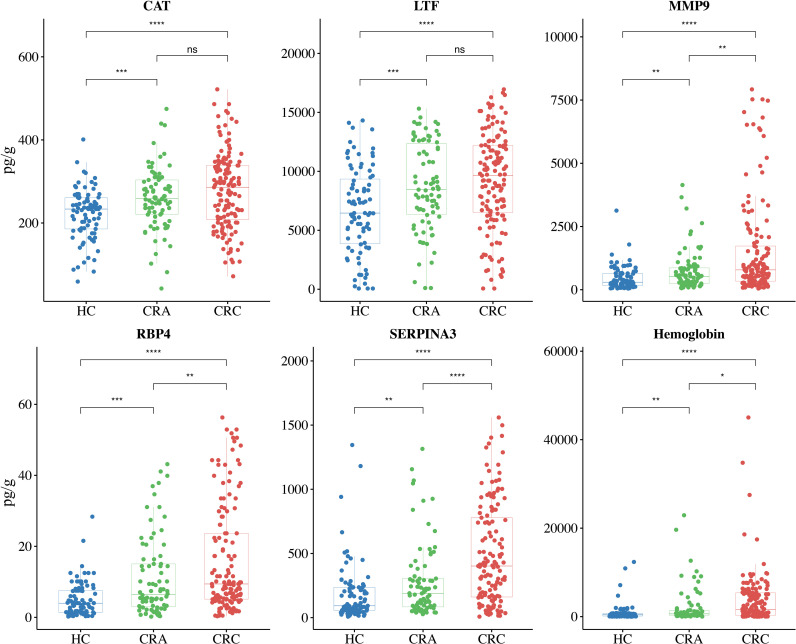
Figure 5.
Protein abundance assays and differential analysis of the biomarker panel and hemoglobin were performed in Validation cohort II. The biomarker panel included CAT, LTF, MMP9, RBP4, and SERPINA3. Validation cohort II (n = 310) included 141 CRC patients (red), 82 CRA patients (green), and 87 HCs (blue), with each dot representing one sample. The unpaired Wilcoxon rank test was used to analyze differences in protein abundance. * P< 0.05, ** P< 0.01, *** P< 0.001, **** P< 0.0001, ns, not significant.

