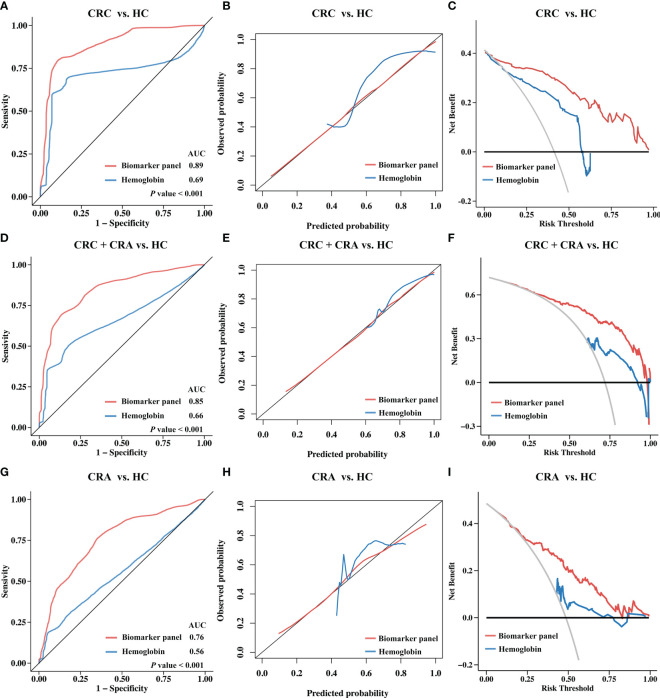
Figure 6.
Diagnostic performance of the biomarker panel in Validation Cohort II and results compared to hemoglobin. Validation cohort II (n = 310) included 141 CRC patients, 82 CRA patients, and 87 HCs. The biomarker panel included CAT, LTF, MMP9, RBP4, and SERPINA3. (A) Receiver operating characteristic (ROC) curve analysis of biomarkers between the CRC and HC groups. The area under the curve (AUC) was compared using the DeLong test. (B) Calibration curve analysis of the biomarker panel between the CRC and HC groups. The closer the curve is to the reference line (black), the more accurate the prediction. (C) Decision curve analysis (DCA) for the biomarker panel between the CRC and HC groups. The larger the area under the curve is, the greater the clinical benefit that can be expected. (D) ROC curves, (E) calibration curve, (F) DCA curve for the biomarker panel and hemoglobin between the CRC+CRA and HC groups. (G) ROC curves, (H) calibration curve, (I) DCA curve for the biomarker panel and hemoglobin between the CRA and HC groups.

